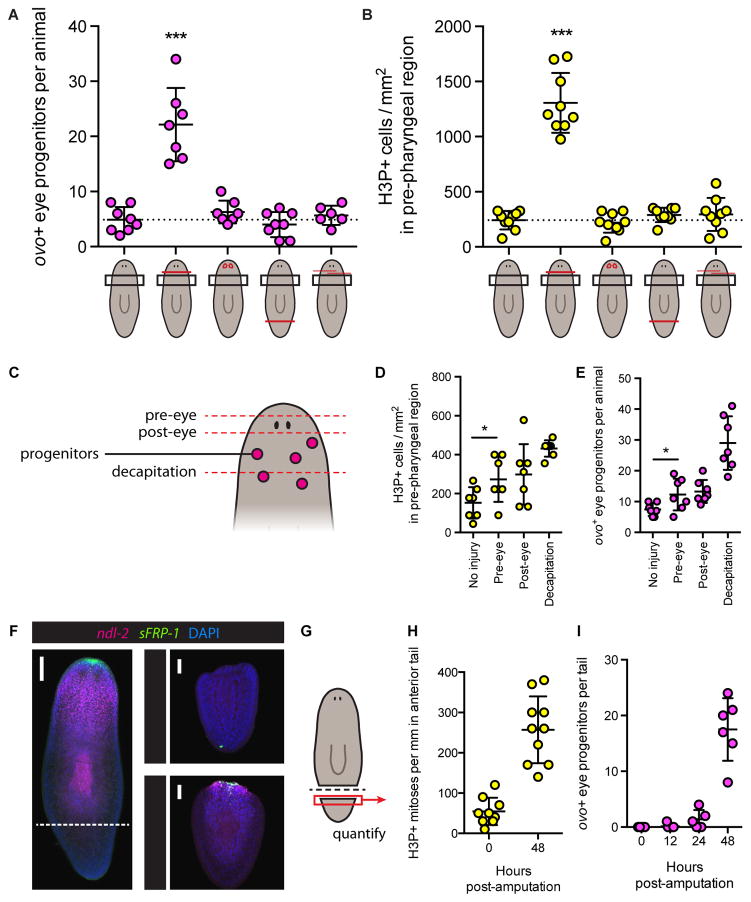
Figure 6. Eye progenitor amplification is associated with wounds that induce proliferation in the location of eye progenitor specification.
(A–B) ovo+ eye progenitors per animal four days post-surgery (A) and H3P+ mitotic cells per mm2 in pre-pharyngeal region two days post-surgery (B). Cartoons depict surgeries with red lines, left to right: no surgery, decapitation, eye resection, tail amputation, anterior incisions. Black boxes represent quantification area. Only decapitation led to elevated eye progenitor numbers and increased density of mitotic cells. Data represented as mean ± SD. Dotted lines indicate mean of uninjured animals. Dots represent values from individual animals. Significance assessed with respect to uninjured animals by one-way ANOVA (***p<0.001).
(C) Cartoon depicting amputation planes (dashed red lines) for surgeries in (D) and (E).
(D–E) H3P+ mitotic cells per mm2 (D) and ovo+ eye progenitors per animal (E) in pre-pharyngeal region following indicated surgeries. Data represented as mean ± SD. Dots represent values from individual animals. Pre-eye amputation increased mitotic density and eye progenitor numbers, as assessed by Student’s t-test (*p<0.05). See also Figure S6A.
(F) Maximum intensity projection of FISH for ndl-2 and sFRP-1 with DAPI labeling in uninjured animal (left) and amputated tails (right), 0 and 48 hours post-amputation (HPA). Dotted line indicates amputation plane. ndl-2 and sFRP-1 are restored in amputated tails by 48 HPA. Numbers in bottom right of tail insets indicate 6 out of 6 animals displayed the expression patterns shown. Scale bars, 100 μm.
(G) Cartoon indicating region quantified in amputated tails for (H) and (I).
(H–I) H3P+ mitotic cells per mm in anterior of tail (H) and ovo+ cells per tail (I), at indicated hours post-amputation. Data represented as mean ± SD. Dots represent values from individual tails.

