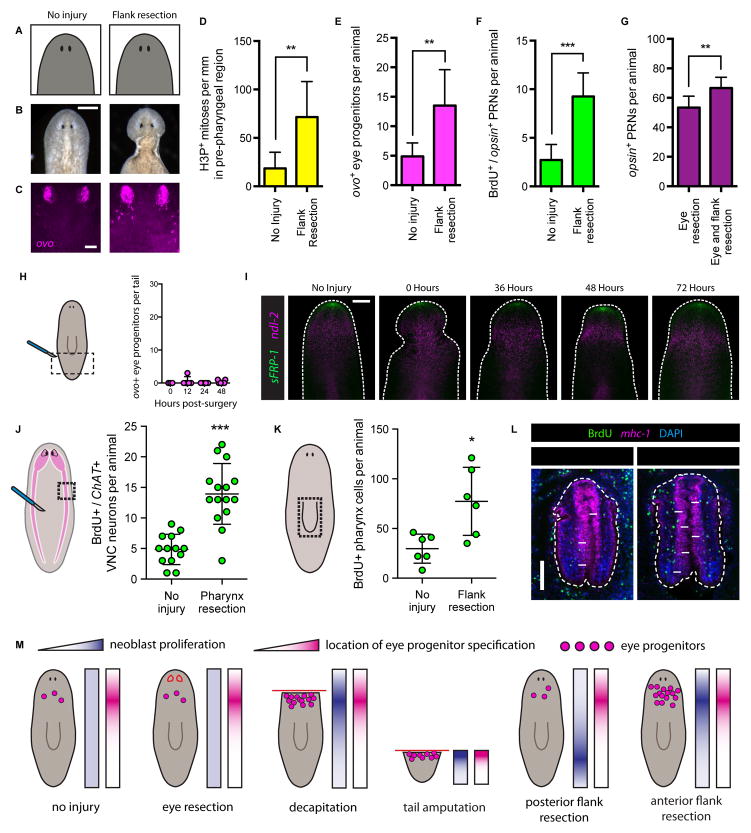
Figure 7. Eye absence is not required for eye progenitor amplification.
(A–C) Uninjured animals (left) and animals that underwent pre-pharyngeal lateral flank resection (right). (A) Cartoon depictions. (B) Live images. Scale bar, 200 μm. (C) FISH for ovo. Scale bar, 50 μm.
(D–G) Pre-pharyngeal flank resection increases eye tissue production. (D) H3P+ mitotic cells per mm in pre-pharyngeal region, 48 hours post surgery. (E) ovo+ eye progenitors per animal four days post surgery. (F) BrdU+/opsin+ PRNs per animal, BrdU pulse-fixation interval Day 1 – Day 7. (G) PRNs per animal one week after eye resection alone or eye and flank resection. Data are represented as mean ± SD. Statistical significance assessed using Student’s t-tests (**p<0.01, ***p<0.001). n≥7 animals per condition. See also Figure S6.
(H) ovo+ eye progenitors per tail 0, 12, 24 and 48 hours post-flank resection. Cartoon depicts surgery (red lines) and area quantified (dotted black lines). Posterior flank resection does not amplify ovo+ eye progenitors in the tail. Dots represent values from individual animals. n≥3 animals per time point.
(I) FISH for sFRP-1 and ndl-2 in anterior of uninjured and anterior flank-resected animals 0, 36, 48 and 72 hours post-surgery. Dashed white line denotes animal boundary. Arrowheads indicate posterior boundary of flank resections. sFRP-1 expression was not detected at the posterior boundary of flank resection. ndl-2 was not posteriorly expanded after flank resection. n≥5 animals per condition. Scale bar, 200 μm.
(J–K) Cartoons indicate location of tissue resection (red lines), and quantification areas (dotted black lines). For (J), pink area represents brain and ventral nerve cords (VNCs). Graphs display number of BrdU+/ChAT+ VNC neurons (J) or BrdU+ cells in pharynx as assessed by mhc-1 staining (K) per animal following no injury or indicated surgery. BrdU pulse-fixation interval Day 1 to Day 7 (J) and Day -1 to Day 4 (K). Data represented as mean ± SD. Dots represent quantified values from individual animals. Statistical significance assessed by Student’s t-test (*p<0.05, ***p<0.001). See also Figure S7.
(L) IF for BrdU with FISH for mhc-1 and DAPI labeling in pharynges of animals following no injury or flank resection. Dashed white lines outline pharynx. Arrows indicate examples of BrdU+ cells inside pharynx. Scale bar, 100 μm.
(M) Summary of conditions leading to eye progenitor amplification. Red lines indicate surgical procedures, pink dots represent eye progenitors. For each surgery, blue gradient rectangles represent regional neoblast proliferation (dark is increased), pink gradient rectangles represent location of eye progenitor specification. Eye progenitors are amplified when neoblast proliferation coincides with location of eye progenitor specification. Eye absence was not sufficient or necessary for eye progenitor amplification.

