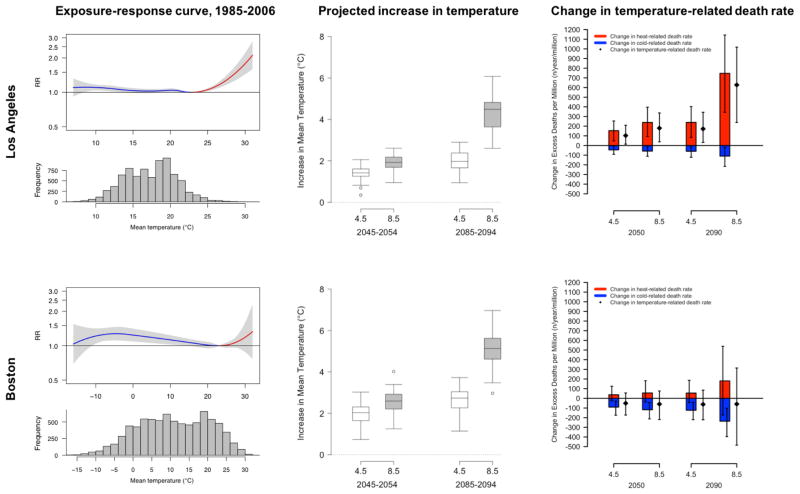
Figure 1.
Exposure-response curves characterizing the present-day relationship between mean daily temperature and mortality (left), increase in mean daily temperature projected by the CMIP5 model ensemble (middle), and projected change in the annual heat-related, cold-related, and total temperature-related mortality rate per million people in the Los Angeles and Boston metropolitan areas in 2050 and 2090 and under two representative concentration pathways (RCP 4.5 and RCP 8.5, right).

