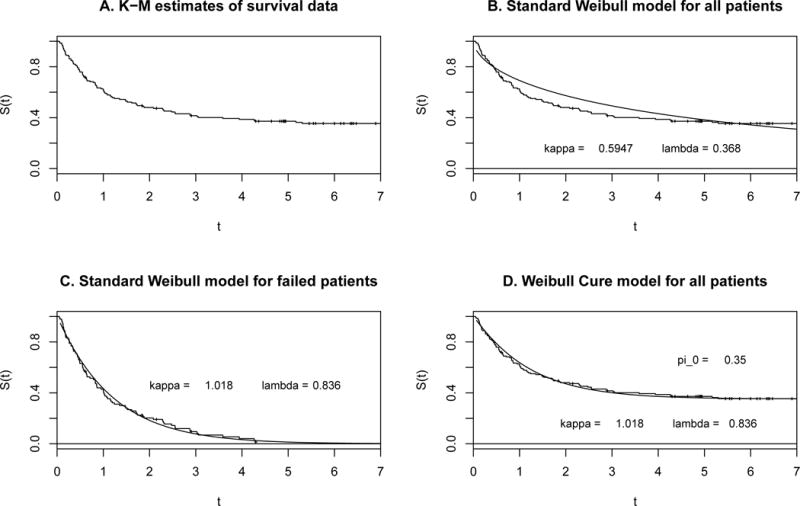
Figure 1. KM curves (step function) and fitted Weibull models (solid curve) for the treatment arm of ECOG trial e1684 data.

Fig. 1A: KM curve for all patients; Fig. 1B: KM curve and Weibull model for all patients; Fig. 1C: KM curve and Weibull model for failed patients; Fig. 1D: KM curve and Weibull cure model for all patients.
