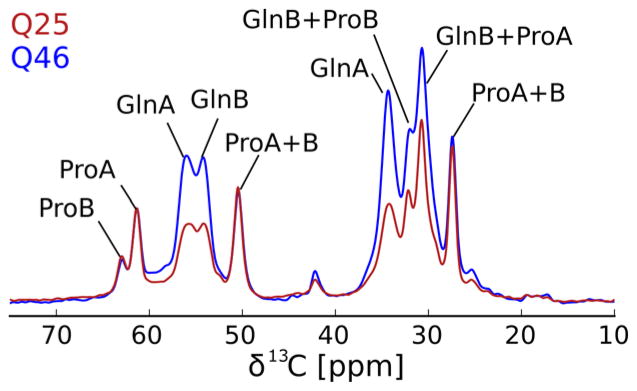
Figure 4.
The intensity of the NMR spectra reflects the smaller size of the fibril core. 1D 13C CP MAS spectra of HTTex1Q46 fibrils and HTTex1Q25 fibrils seeded with HTTex1Q46, recorded at 25 kHz MAS, 0°C and normalized according to the intensity of the proline peaks. Consequently, the intensity of the Gln Cα lines of the HTTex1Q25 fibrils is half of the corresponding line in the HTTex1Q46 fibrils showing that roughly the same percentage of Gln are incorporated into the fibrils formed by both proteins.

