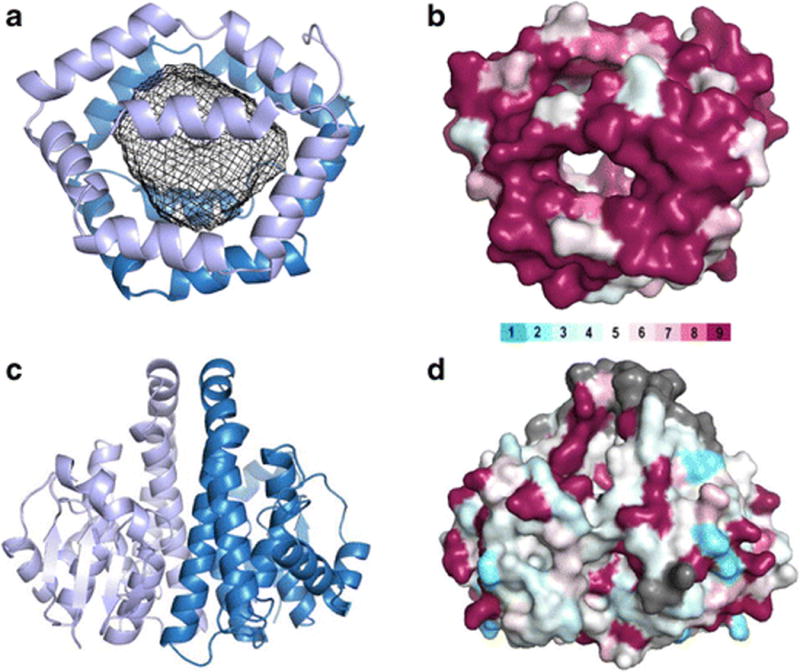
Figure 2. Structural analyses of Bla g 1 and Bla g 5.

Bla g 1 (4JRB, panels A and B) and Bla g 5 (4QR5, panels C and D) are presented as ribbon diagrams (panels A and C) and surface representations (panels B and D). Bla g 1 in panel A is colored blue and light blue to differentiate the two hemispheres of 6 helices (all from one polypeptide chain) that encapsulate a large hydrophobic cavity, shown with a mesh rendering. Bla g 5 in panel C is colored blue and light blue to show the two polypeptide chains that come together to form a typical GST dimer. In panel B, Bla g 1 is colored based on similarity to Per a 1, and in panel D, Bla g 5 is colored with respect to similarity to Der p 8. The color bar represents residue similarity from low (light blue) to high (maroon) [95]. Gray represents gaps or insertions in the sequence alignment. Visual analysis of the coloring shows the structural basis of cross-reactivity for Bla g 1 and Per a 1 and the lack of significant cross-reactivity between Bla g 5 and Der p 8, which has been experimentally confirmed.
