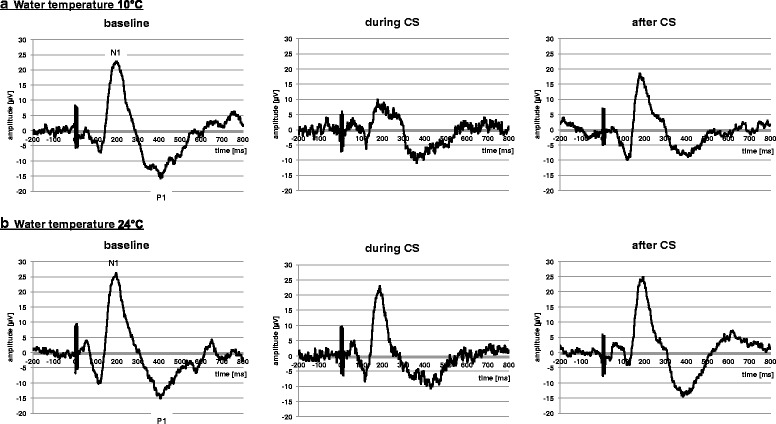
Fig. 3.

PCES-EPs of one participant shown at baseline, during CS, and after CS in both conditions: a) water temperature 10 °C, and b) water temperature 24 °C

PCES-EPs of one participant shown at baseline, during CS, and after CS in both conditions: a) water temperature 10 °C, and b) water temperature 24 °C