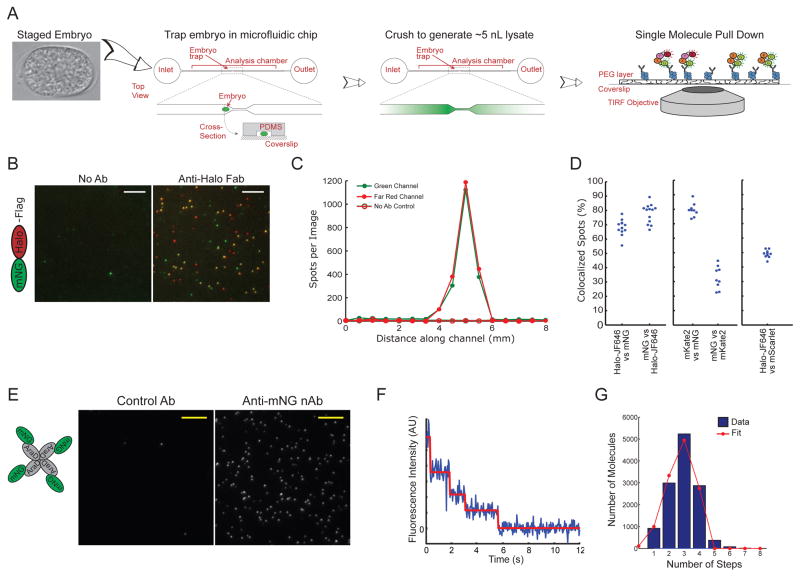
Figure 1. A single-cell biochemistry assay for the C. elegans zygote.
A) Illustration of the approach. A C. elegans embryo, staged based on morphology, is placed into a flow chamber and trapped in the center by a small constriction. The embryo is crushed to generate a lysate, and proteins of interest are captured using antibodies bound to the coverglass floor of the chamber. The device is placed directly on a TIRF microscope to interrogate molecular complexes via single-molecule imaging.
B) Images of mNG::HaloTag molecules pulled down from a single embryo labeled with JF646 HaloTag ligand. The mNG channel is shown in green and the JF646 (far red) channel is shown in red. Scale bars represent 5 μm.
C) Quantification of the number of green and far-red spots per image as a function of position along the length of the chamber.
D) Quantification of the fraction of colocalized spots for an mNG::HaloTag fusion protein labeled with JF646 (left graph), an mNG::mKate2 fusion protein (center graph) or an mScarlet-I::HaloTag fusion protein labeled with JF646 (right graph).
E) Images of mNG::AraD tetramers pulled down from a single embryo. Scale bars represent 5 μm.
F) Example of a photobleaching trace from a single mNG::AraD complex, showing four photobleaching steps.
G) Blue bars: histogram showing the distribution of photobleaching step counts in a population of molecules (data from four single-embryo experiments are combined). Red line: fit of the data to the binomial distribution , where PN is the probability of detecting N photobleaching steps given the fraction d of mNG molecules detected in this assay.
See also Figures S1, S2 and S3.

