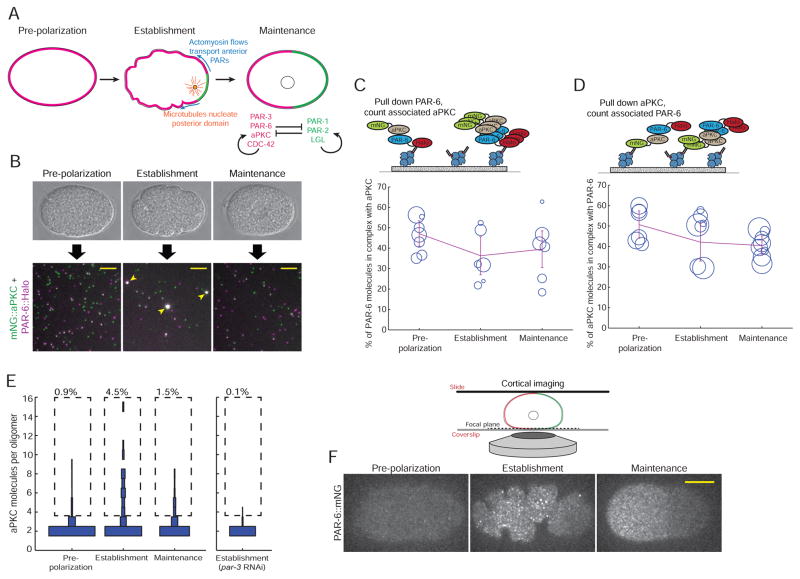
Figure 2. aPKC and PAR-6 are constitutively associated but dynamically oligomerize.
A) Illustration of the events that lead to zygote polarization. See text for a detailed description.
B) Schematic of a SiMPull experiment to analyze the PAR-6/aPKC interaction. Individual embryos were staged based on morphology, and endogenously tagged PAR-6::HaloTag was pulled down. The single-molecule images shown are actual data from pull-downs at the indicated stages. Scale bars represent 5 μm. Note that the oligomeric complexes (arrowheads) are not macroscopic; they are diffraction-limited objects, but appear larger because the images were scaled so that monomers would be visible.
C, D) Measurements of the fraction of PAR-6 molecules in complex with aPKC (C) or the fraction of aPKC molecules in complex with PAR-6 (D) at the indicated stages. Each circle in the plots shows the result of one single-cell experiment, with the size of the circle representing the number of molecules that were counted in that experiment. The lines show the weighted mean, and error bars represent 95% confidence intervals.
E) Measurement of the fraction of PAR-6/aPKC heterodimers found in oligomers of different sizes. The experiment was conducted by pulling down PAR-6::HaloTag and counting the number of co-precipitated mNG::aPKC molecules in each complex. For each stage, the distribution of numbers of molecules found in oligomers of different sizes is shown as a vertical histogram. For clarity, the monomer fraction (80–90% of total molecules) is not shown. n = 10,138 molecules counted from 7 embryos for pre-polarization phase, n = 5,698 molecules counted from 6 embryos for establishment phase, n = 5,550 molecules counted from 6 embryos for maintenance phase and n = 6,944 molecules counted from 7 embryos for establishment embryos derived from mothers treated with par-3 RNAi.
F) Images of cortical PAR-6::mNG in live embryos at the indicated stages. Anterior is to the left. Scale bar represents 10 μm.

