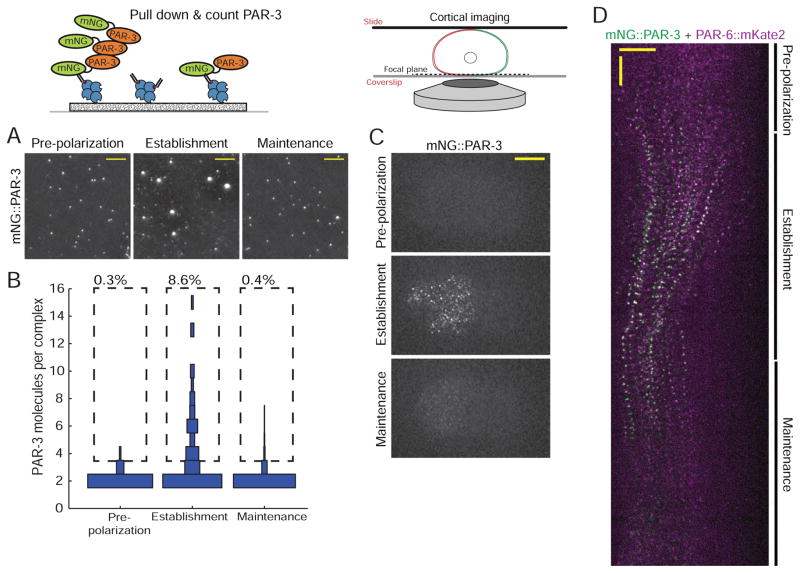
Figure 3. PAR-3 forms large oligomers during polarity establishment.
A) Images of mNG::PAR-3 pulled down from embryos of the indicated stages. Scale bars represent 5 μm.
B) Measurement of the abundance of mNG::PAR-3 oligomers of different sizes as a function of embryonic stage. For each stage, the distribution of numbers of molecules found in oligomers of different sizes is shown as a vertical histogram. For clarity, the monomer fraction (80–90% of total molecules) is not shown. n = 5,914 molecules counted from 7 embryos for pre-polarization phase, n = 4,741 molecules counted from 9 embryos for establishment phase and n = 17,201 molecules counted from 9 embryos for maintenance phase.
C) Images of cortical mNG:PAR-3 in live embryos at the indicated stages. Anterior is to the left. Scale bar represents 10 μm.
D) Kymograph of cortical mNG::PAR-3 (green) and PAR-6::mKate2 (magenta) during the first cell cycle. Anterior is to the left. Horizontal scale bar represents 10 μm and vertical scale bar represents 1 min.

