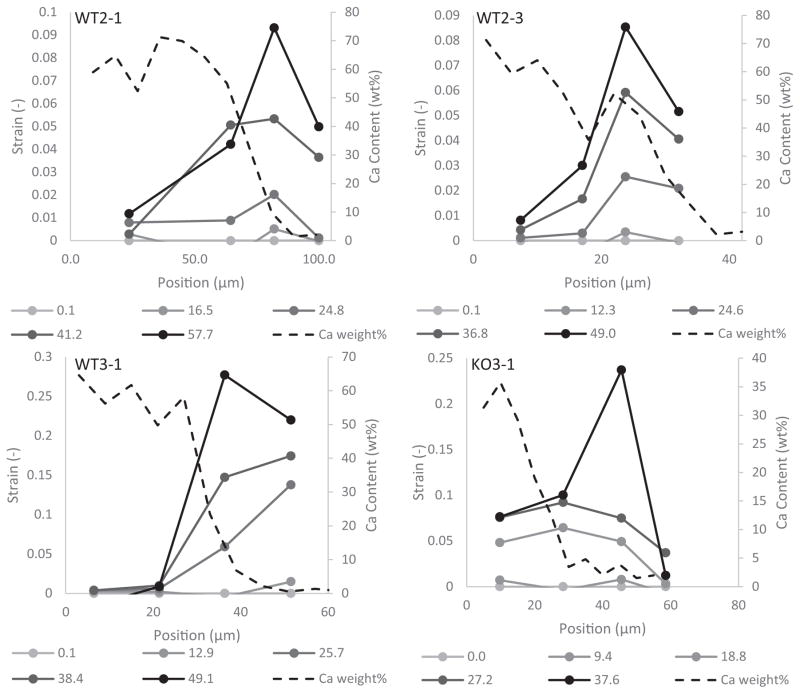
Fig. 7.
Plots of local strain vs. position at multiple stresses (legend) for all of the samples for which local strains were measured. Dotted lines represent the calcium content as a function of position for each sample. The highest strain levels were not localized to the region closest to the tendon but instead within the beam near the gradient region. This indicates the presence of a region of high deformation within the enthesis.

