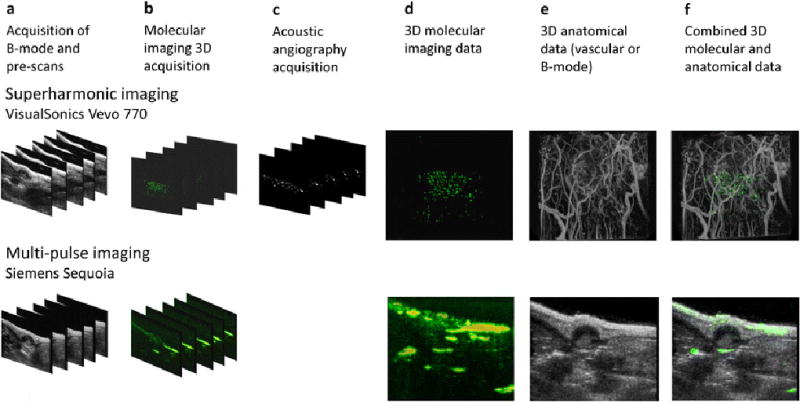
Fig. 1.

Data acquisition and image processing flow for both superharmonic (acoustic angiography; top row) and multi-pulse (bottom row) ultrasound molecular imaging. All animals were imaged using both systems on the same day. a 3D B-mode and contrast-specific pre-scans are acquired using a motorized motion stage. b Targeted contrast agent is administered and 3D images are acquired in contrast-specific imaging modes after a 12 min wait. Targeted bubbles are then destroyed by high MI scanning, and a post-scan is acquired. c Free microbubbles are administered and a microvascular imaging or “acoustic angiography” scan is acquired for the superharmonic imaging case only. Using the described data sets, it is now possible to combine d 3D molecular imaging data sets on both systems, with e either vascular or B-mode data to produce f combined visualizations of anatomical and functional imaging data.
