Fig. 2.

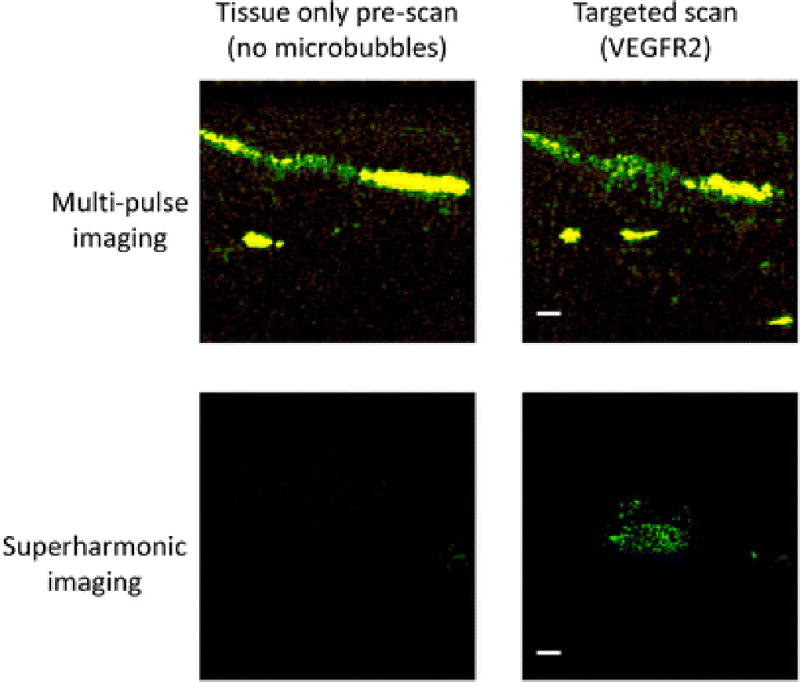
Illustrative images for the cases shown in Fig 1 demonstrate the tissue-only images before a bolus injection of 1.25×10⁶ microbubbles for both multi-pulse and superharmonic ultrasound molecular imaging. Scale bars represent 2 mm.

Illustrative images for the cases shown in Fig 1 demonstrate the tissue-only images before a bolus injection of 1.25×10⁶ microbubbles for both multi-pulse and superharmonic ultrasound molecular imaging. Scale bars represent 2 mm.