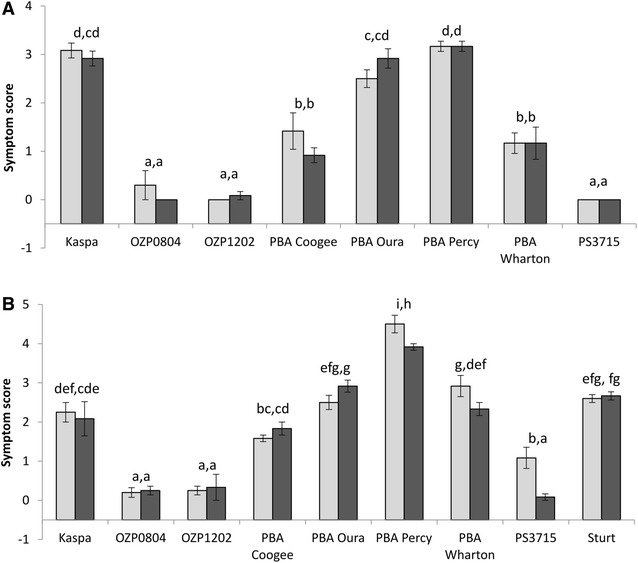
Fig. 1.

Boron toxicity symptom scores of field peas in hydroponic experiments 1 (A) and 2 (B) grown from immature (light grey) and mature (dark grey) seed. Error bars represent ± 1 standard error. Letters at top of bars indicate significance (P = 0.05) groupings of means (within each experiment) according to ‘LSD.test’ in RStudio. NB. X-axis crosses at Y = −0.5 to better illustrate genotypes with low average scores
