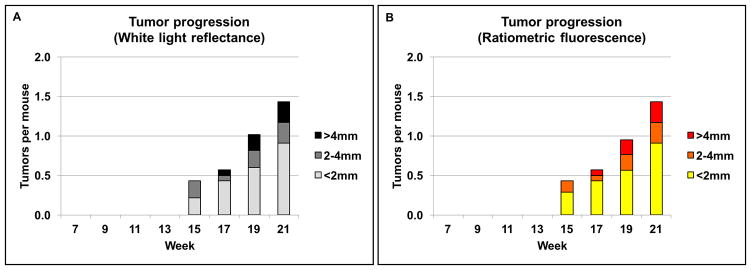
Figure 2. Tumor progression in cohort 1 (n=14).
Number of tumors and the tumor size distribution shown over time as detected by white light reflectance (A) and, Cy5:Cy7 ratiometric fluorescence (B). Tumor detected with white light and ratiometric fluorescence (RF) was similar in both number of tumors detected and size of individual tumors.

