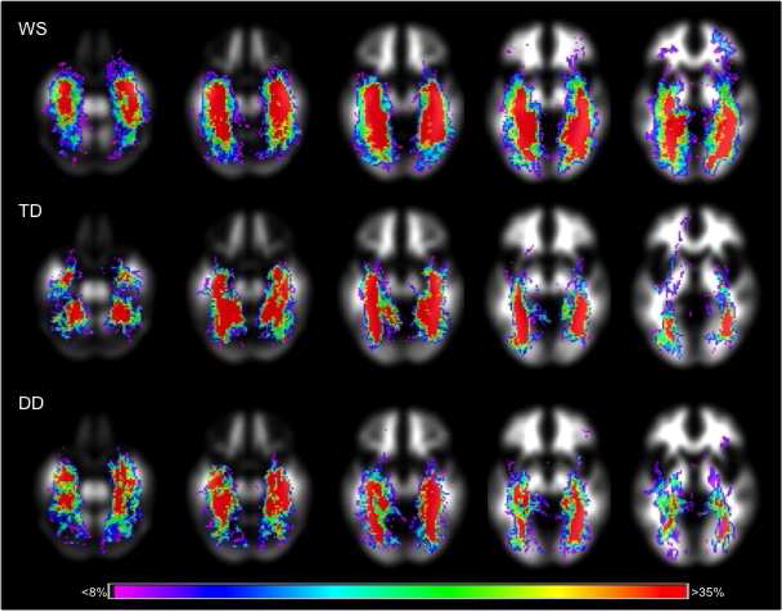
Figure 2.

Probabilistic maps of reconstructed white matter fibers projecting through the fusiform gyrus in the WS (N = 20), TD (N = 10) and DD (N = 10) groups. Color scale corresponds to the relative probability of reconstructed fibers being present within each group.
