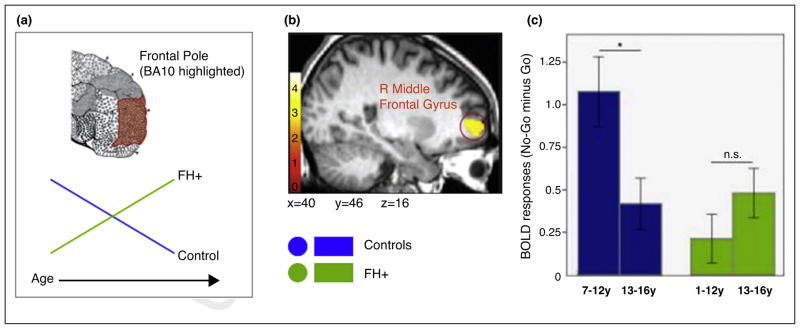
Figure 3.
A. The schematic diagram illustrating the developmental shift in the frontal pole (FP) activation (BA10 highlighted) during the Go/No-Go task. The green and blue lines represent individuals with FH+ and controls, respectively: B. The blood oxygen level dependent activation associated with the “No-Go minus Go” contrast in the right lateral FP (FP-lat) that exhibits “age × FH status” interaction. Note that originally this region was labeled as “R Middle Frontal Gyrus”, but we relabeled it as the right FP-lat based on both the Harvard–Oxford Atlas and the FP subregions defined by Liu et al. [31]. C. The bar graph showing the effect of “age × FH status” interaction on the right FP-lat activation. The blunted activation at baseline (age range: 7–12 years) increased with age in the FH+ group (right, green bars), but the opposite pattern of developmental shift characterized controls (left, blue bars). From Hardee et al. [28••].

