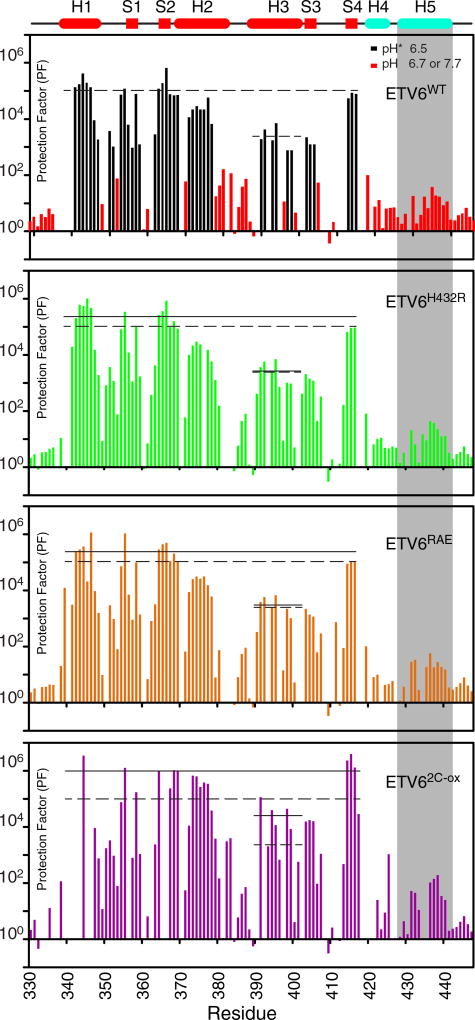
Fig. 3.
HX measurements provide a measure of local and global protein stability. HX PFs for ETV6WT and its variants were merged from a combination of experiments (Supplementary Table S1). In the case of ETV6WT, black and red bars indicate data collected by protium–deuterium HX (uncorrected pH* 6.5) and protium–protium CLEANEX (pH 6.7 or 7.7) experiments, respectively. This is not differentiated for the three variants. The estimated PF errors are 5% to 15%, and in the upper cartoon, cylinders and rectangles indicate α-helices and β-strands, respectively. The average PFs for the ETS domain (residues in helices H1 and H2 and strands S1, S2 and S4), and for the recognition helix H3 are shown as solid lines for each variant species in its respective panel; the corresponding values for ETV6WT are shown as dashed lines in all panels. For better visualization, the data for residues in helix H5 (gray shading) are overlaid in Fig. 4. A comparison of these average PFs shows that the designed substitutions stabilize the ETS domain against HX.

