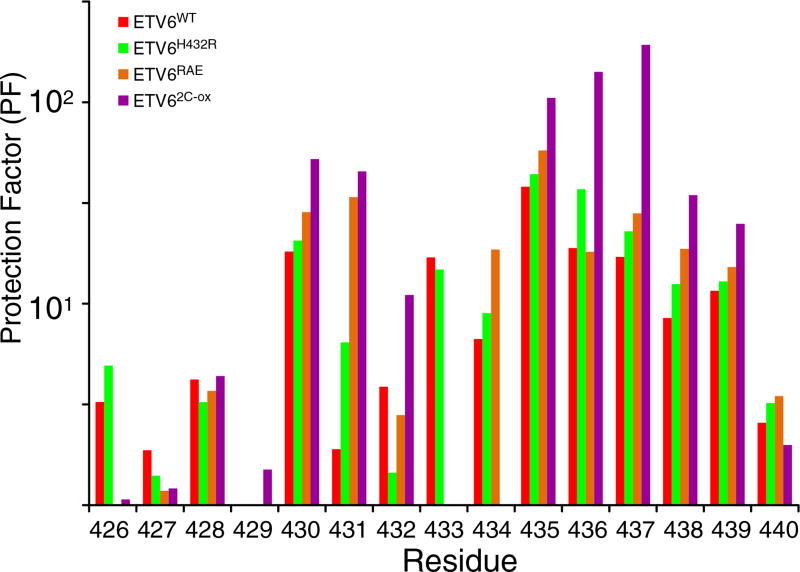
Fig. 4.
HX measurements demonstrate the stabilization of helix H5. PFs for helix H5 residues in ETV6WT and its variants are shown. The data were derived from protium– protium CLEANEX experiments recorded at several temperature and pH values (Supplementary Table S1). The estimated PF error is 5% to 15%. Most residues exhibit a progressive increase in protection against HX in the order of ETVWT < ETV6H432R < ETV6RAE < ETV62-C-ox indicating progressive stabilization of helix H5 by the designed substitutions. Residue-specific variations within this trend could arise for many reasons, including exchange from partially, rather than fully, unfolded states of the inhibitory helix, as well as errors in the measured (kex) and predicted (kint) rate constants for each residue and the assumption that PFs are independent of sample pH and temperature over the range of conditions used for these measurements. Accordingly, the averaged PFs for the inhibitory helix amides are summarized in Table 1 and Fig. 6.

