Fig. 6.
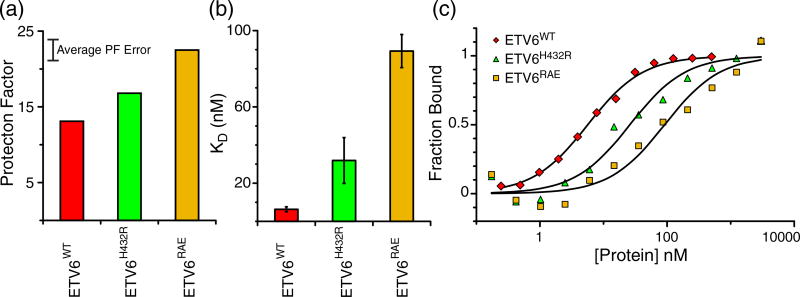
Helix H5 stabilization weakens ETV6 DNA binding. (a) Average PFs of helix H5 residues of ETV6WT and the stabilized variants ETV6H432R and ETV6RAE. An approximate 10% PF error is indicated. (b) Equilibrium dissociation constants (KD values) for ETV6WT, ETV6H432R and ETV6RAE. These KD values increase as the PFs and hence stability of helix H5 increase. (c) Representative EMSA DNA binding data. Symbols and solid lines represent fraction DNA bound as determined from band intensities of free DNA and data fitting to a 1:1 binding model, respectively.

