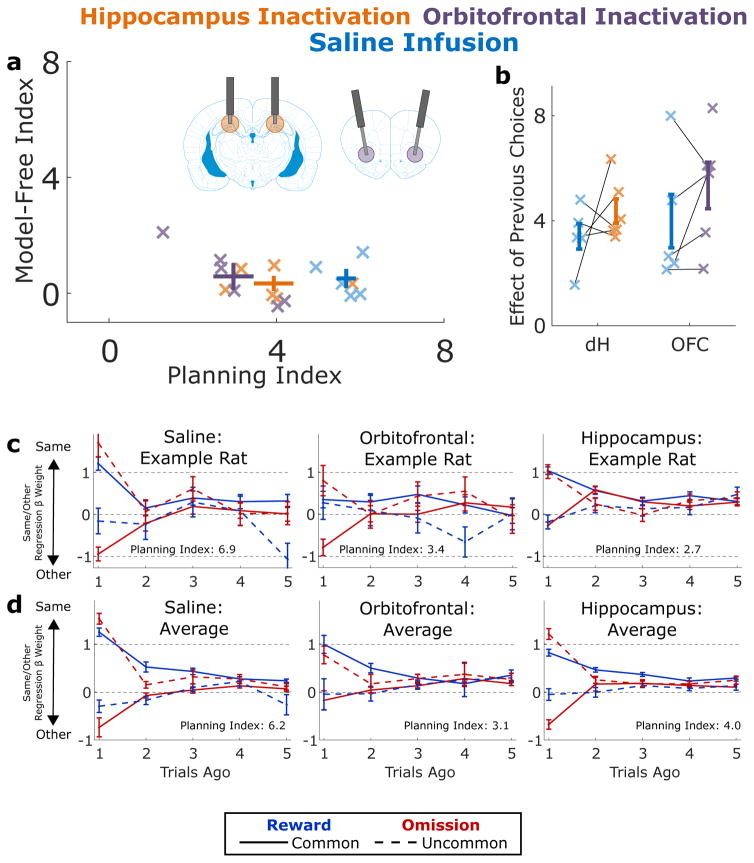
Figure 4.
Effects of Muscimol Inactivation. A) Planning index and model-free index for implanted rats (n=6) performing the task on OFC inactivation sessions (purple), dH inactivation sessions (orange) and pooled saline infusions (blue; pooled for display). Inactivation of either region significantly decreases the planning index. Error bars show mean across rats and standard error. B) Main effect of past choice on future choice during the same sessions (saline session unpooled). Inactivation has no significant effect on this measure. Error bars show mean across rats and standard error. C) Results of the same/other regression analysis applied to data from an example rat on saline sessions (left), OFC infusions (middle), and dH infusions (right). D) Average over all rats of the results of the same/other regression analysis.

