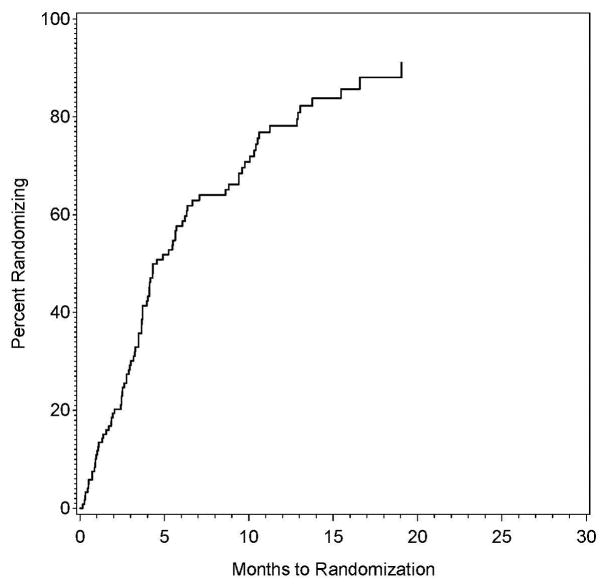
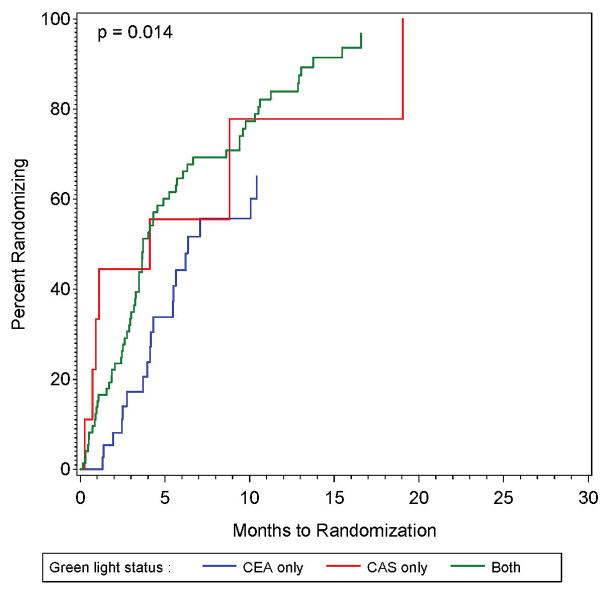
Figure 2.
Figure 2A and 2B: The proportion of sites approved for randomization that had randomized one or more patients as a function of time since approval for randomization (left panel), also shown by whether the site was approved for randomization only in the CEA plus intensive medical management vs intensive medical management study, only in the CAS plus intensive medical management versus intensive medical management study, or in both studies.


