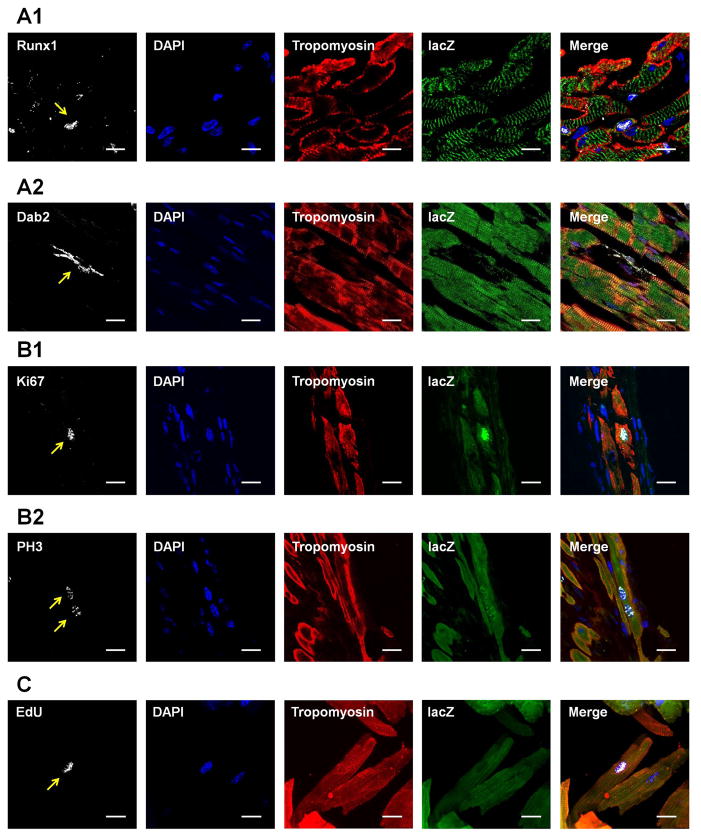
Figure 5. Dedifferentiation, proliferation and redifferentiation of ACMs in Myh6-MerCreMer-lacZ mice subjected to MI.
A: Representative images of ACMs expressing dedifferentiation markers Runx1 (A1) or Dab2 (A2) in the infarct border zone. B: Representative images of ACMs expressing proliferation markers Ki67 (B1) and PH3 (B2). C: Representative images of a mononuclear lacZ+/EdU+ ACM isolated from hearts 3 weeks after MI. The organized sarcomere was clearly seen in the ACM. For A–C, scale bars represent 20 μm.

