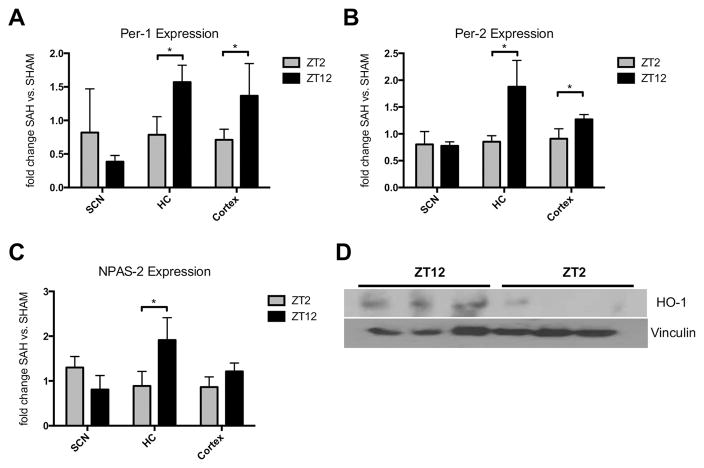
Figure 3. SAH onset time determines changes in circadian rhythm gene expression.
A–C: Changes in Per-1 (A), Per-2 (B) and NPAS-2 (C) expression in the suprachiasmatic nucleus (SCN), hippocampus (HC), and cortex of animals subjected to SAH at zeitgeber time (ZT) 2 and ZT12 compared to animals with SHAM procedures at the same time points. Samples were collected exactly 7 days after procedures to analyze the effect purely related to SAH and onset time. A: ZT2 vs. ZT12 *p=0.0212 for HC, *p=0.044 for cortex; B: *p=0.0242 for HC, *p=0.0386 for cortex; C: *p=0.0412 for HC; D: Cerebral heme oxygenase (HO)-1 protein expression analyzed by Western Blot and normalized to vinculin in animals at ZT2 and ZT12. Results represent mean ± SD with n=3–4 mice/group.

