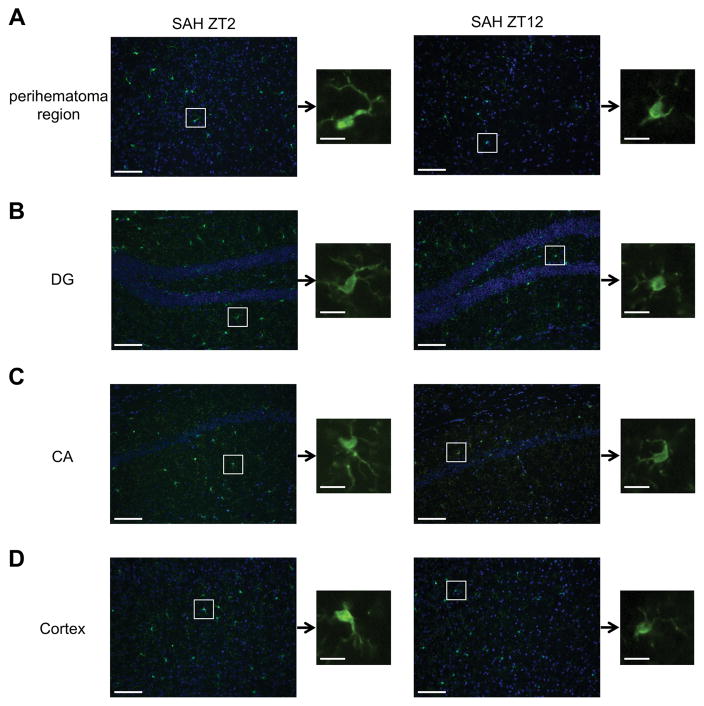
Figure 5. The extent of neuroinflammation depends on SAH onset time.
A–D: Immunohistochemical staining for Iba-1 (green) showing the morphology and quantity of microglia cells after SAH at ZT2 and ZT12 in the perihematona region at the base of the brain (A), dentate gyrus (DG, B), cornu ammonis (CA, C) and cortex (D). Nuclei were counterstained with Hoechst 33258 (blue). Higher magnification images (20x) show the representative changes in microglia morphology. White boxes show the location of the magnified microglia. Microglia at ZT2 (left panel) show elongated cell bodies and thickened processes indicative of activation. All images are representative of 3–4 mice/group with 3 sections/brain. Scale bar = 50μM for the low magnification images and 10μM for the single cell images.

