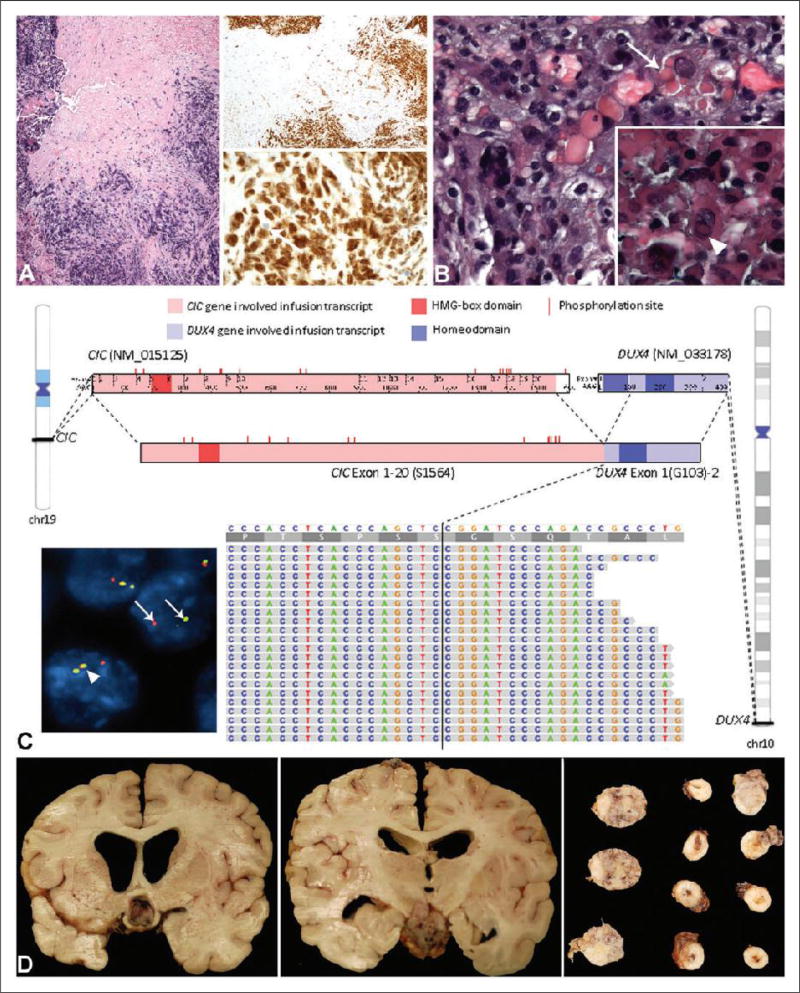
Figure 2.
(a), Hematoxylin and eosin (H&E) and WT-1 stains of the recurrent tumor. The H&E section (left panel) shows neoplastic cells with associated crush artifact. On low-power magnification, there is diffuse staining of the tumor with the antibody to WT-1 (right upper panel). The high-power magnification of the WT-1 stain shows primarily nuclear staining of the neoplastic cells (right lower panel). An occasional intermixed nucleus without staining is noted (arrow). (b), H&E section of the tumor from the third resection after radiation and chemotherapy. There are more pleomorphic nuclei including multilobated nuclei and eosinophilic cytoplasmic globules are noted within a subset of cells (arrow). Inset: Occasional neoplastic cells also demonstrate nuclear pseudoinclusions (arrowhead). (c), Comprehensive genomic profiling (CPG) image with fluorescent in-situ hybridization (FISH) as inset on the lower left. CPG identifies a CIC-DUX4 fusion transcript, in which exons 1–20 of CIC [NM_015125, chr19:42,788,817-42,799,949 (hg19); breakpoint at S1564] is fused with exon 1 of DUX4 [NM_033178, chr10:135,480,558-135,485,241 (hg19); breakpoint at G103]. The fused transcript maintains the HMG-box domain of CIC as well as most of the MAPK phosphorylation sites. One complete homeodomain in DUX4 is maintained. The IGV screenshot at the bottom shows the alignment of RNA reads that cross the CIC-DUX4 breakpoint to the CIC-DUX4 fusion sequence. Exact breakpoint locations are indicated by vertical black lines. CIC phosphorylation sites are annotated based on UniProtKB entry Q96RK0 (CIC_HUMAN). HMG-box: high-mobility group box. Inset: FISH performed on a section from the autopsy specimen demonstrates rearrangement of the centromeric probe (red) and telomeric probe (green) of the CIC gene (arrows). This contrasts with a nucleus without rearrangement in which the overlapping red, yellow, and green signals are noted (arrowhead). (d), Collage of sections of the intracranial and spinal tumor from the autopsy. The left panel shows tumor compression of the optic chiasm, while the middle panel shows tumor adjacent to the medial temporal cortex. The right panel demonstrates tumor around the spinal cord (right two columns) and from the cerebello-pontine angle (left three sections).

