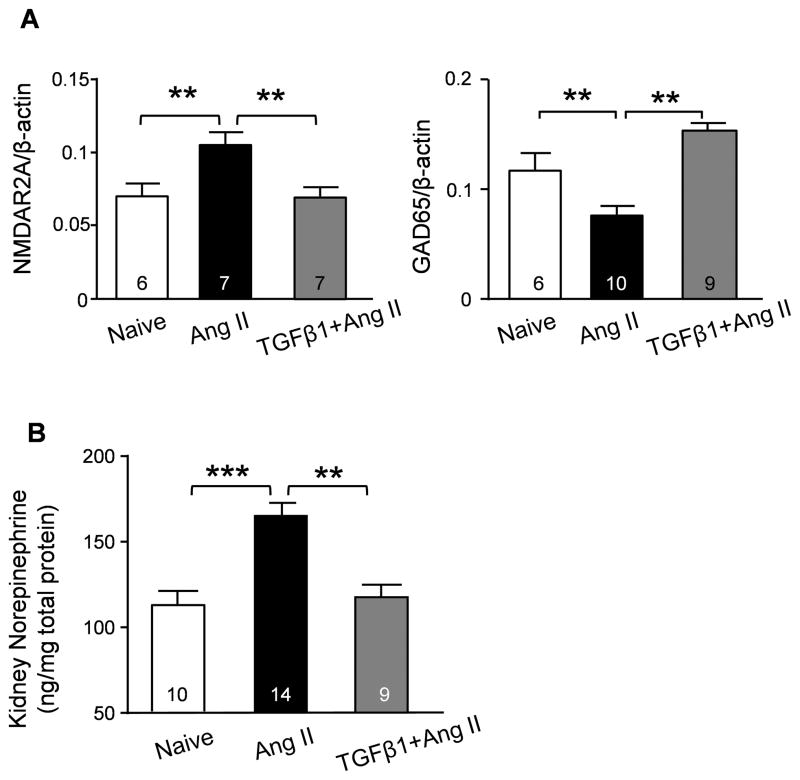
Figure 2. Effects of brain TGFβ1 treatment on neural activity and humoral expression.
(A) Summary semi-quantification of Western blots of NMDAR2A and GAD65 in hypothalamus and brain stem tissues derived from naïve, Ang II- and TGFβ1+Ang II-treated mice. (B) Norepinephrine level was examined by ELISA in kidney lysates from naïve, Ang II- and TGFβ1+Ang II-treated mice. ** P<0.01; *** P<0.001.

