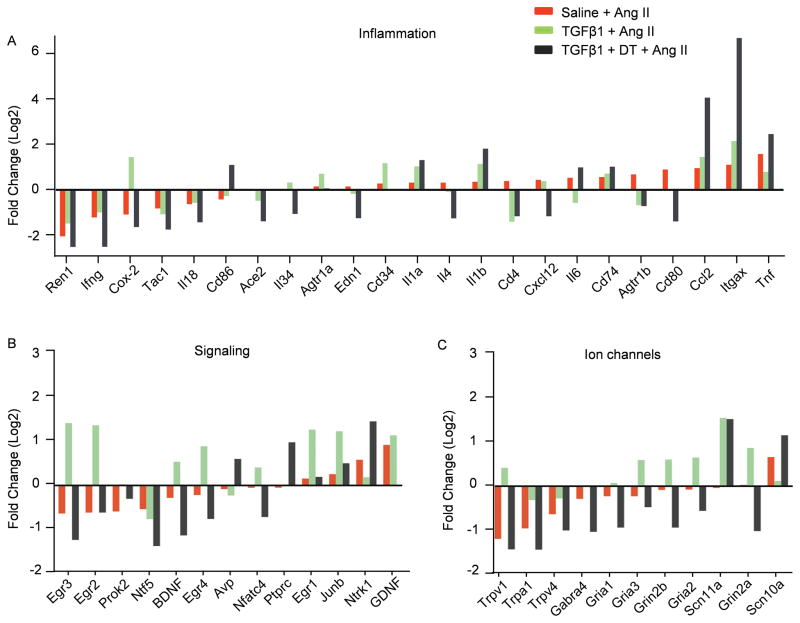
Figure 6. Molecular signature of neuroplasticity and neuroinflammation associated with hypertension and TGFβ.
qRT-PCR array of PVN and brain stem lysates isolated from 4 groups of mice. Genes whose expression changed by more than twofold across all four populations are grouped into three categories: (A) inflammatory factors, (B) signaling regulators and (C) ion channels. The genes were arranged from low to high according to the fold changes in Ang II-treated mice compared with naïve controls (red column). Each column indicates the log2 value of the fold change when compared to the data from naive mice. The means of three independent experiments are shown.

