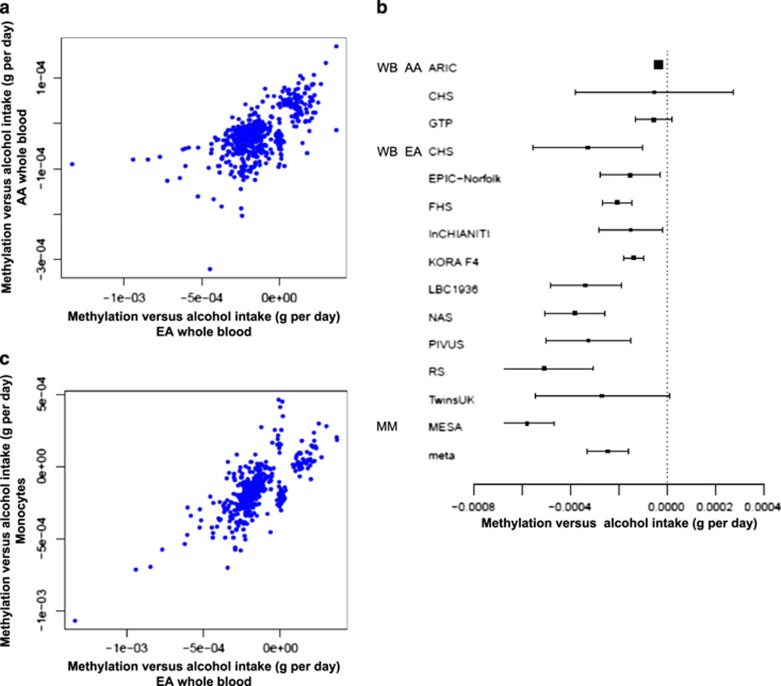
Figure 4.
Comparison of regression coefficients of the significant cytosine-phosphate-guanine dinucleotides (CpGs) in association analysis of the continuous alcohol trait (g per day): (a) between European and African whole-blood samples; (b) the Forest plot of effect estimates and standard errors of cg11376147 in all study cohorts; and (c) between European whole-blood and CD14+ monocyte samples. (a) Includes a list of CpGs with P<1 × 10⁻⁷ in EA or AA whole-blood samples and (c) includes a list of CpGs with P<1 × 10⁻⁷ in EA whole-blood samples or in monocyte samples of mixed ancestries. The Pearson’s correlation was r=0.64 between the effect estimates in (a) and r=0.72 in (c). MM, monocyte, mixed ancestries; WB AA, whole blood, African ancestry; WB EA, whole blood, European ancestry.

