Figure 1.
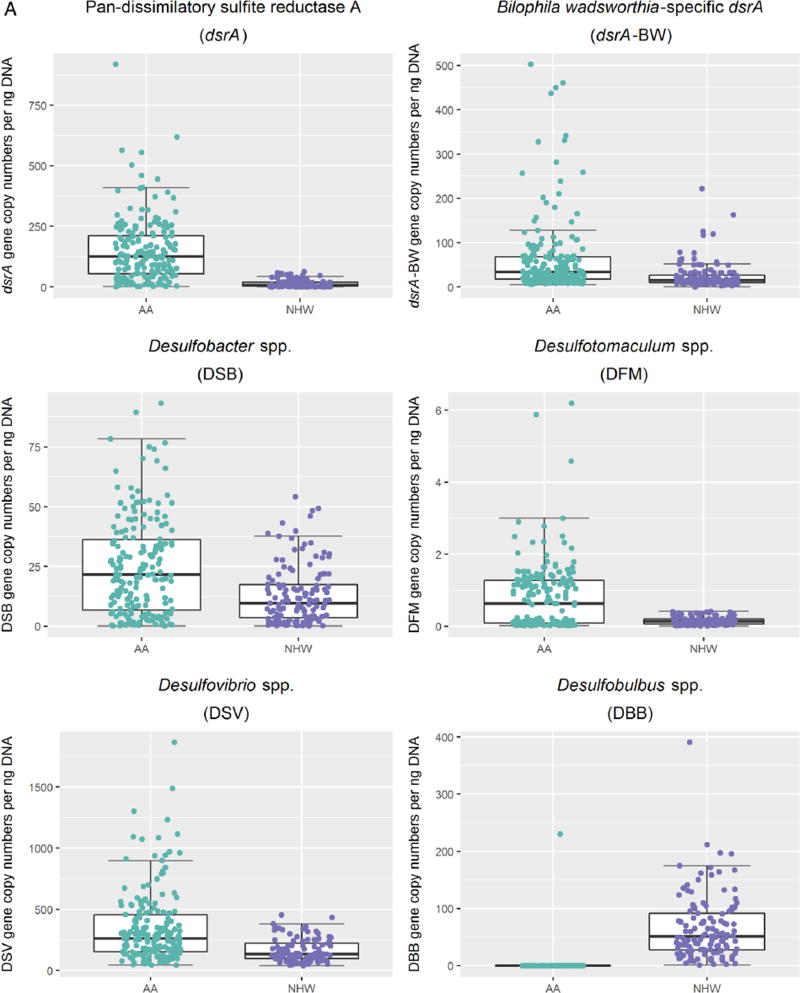
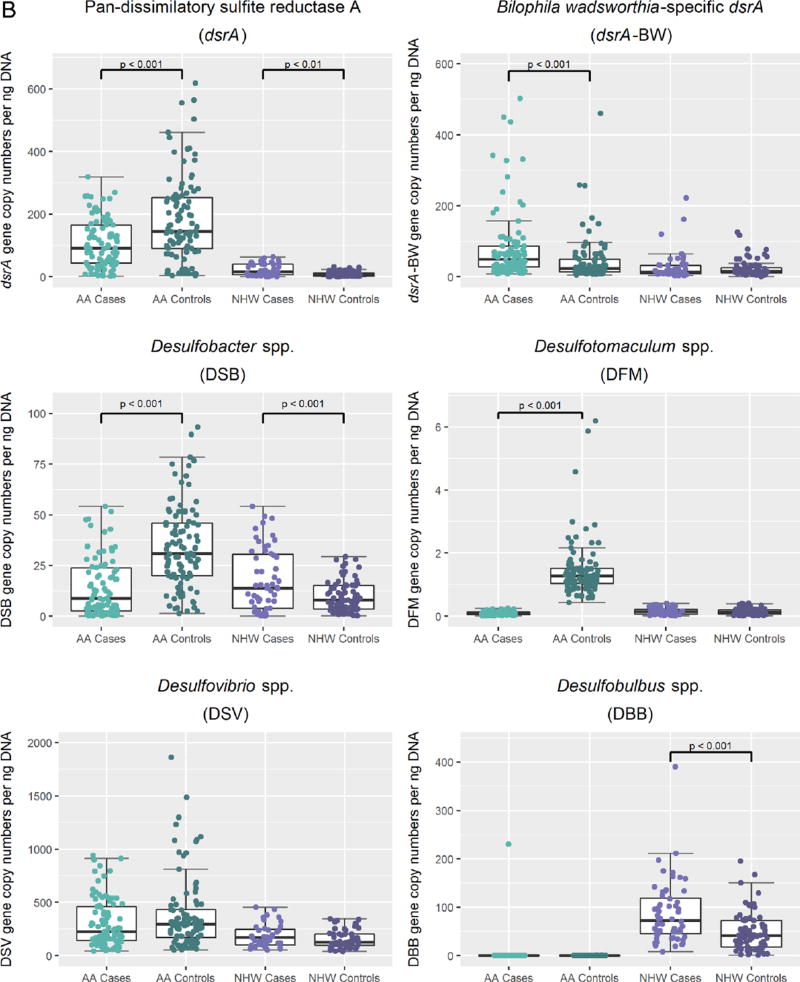
Differences in mean gene copy numbers of sulfidogenic bacteria comparing colorectal cancer cases and controls in African Americans (AAs) and non-Hispanic whites. A. Scatterplot representations of mean gene copy numbers per nanogram of DNA of sulfidogenic bacterial targets in African Americans compared with non-Hispanic whites with median and upper and lower quartiles indicated. African Americans are represented in green, and non-Hispanic whites are represented in purple. All comparisons had a p<0.001. B. Scatterplot representations of mean gene copy numbers per nanogram of DNA of sulfidogenic bacterial targets in cases and controls in each racial group. African Americans cases are represented in light green and controls in dark green. Non-Hispanic white cases are represented in light purple and controls in dark purple.


