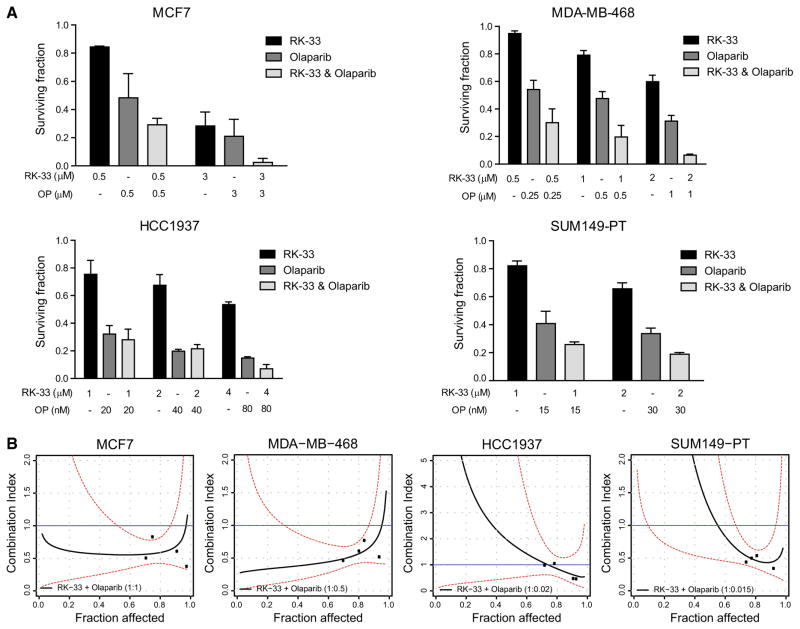
Fig. 3.
Synergy between RK-33 and the PARP inhibitor olaparib. a Bar graphs representing the surviving fraction in a colony formation assay after RK-33, olaparib or combination treatment in BRCA1-proficient (MCF7 and MDA-MB-468) and BRCA1-deficient breast cancer cell lines (HCC1937 and SUM149-PT). b CI-Fa plots showing the combination index (CI) and 95% confidence intervals of RK-33 olaparib combination therapy for different fractions affected (Fa) in BRCA1 pro- and deficient cell lines. Lines represent modeled CI curves. Points represent CI values calculated from measured data points. Dashed red lines represent 95% confidence intervals. Blue lines represent additivity reference line. Graphs represent mean of independent experiments ± SD

