
Figure 4.
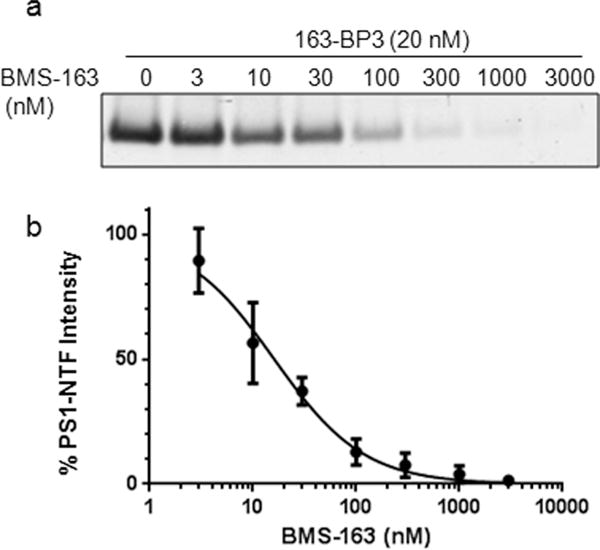
Labeling of PS1–NTF in live cortical neurons. (a) Western blot of PS1–NTF showing dose dependent competition of 163-BP3 labeling with BMS-163. (b) Inhibitory curve for competition with BMS-163.
Official websites use .gov
A
.gov website belongs to an official
government organization in the United States.
Secure .gov websites use HTTPS
A lock (
) or https:// means you've safely
connected to the .gov website. Share sensitive
information only on official, secure websites.
Labeling of PS1–NTF in live cortical neurons. (a) Western blot of PS1–NTF showing dose dependent competition of 163-BP3 labeling with BMS-163. (b) Inhibitory curve for competition with BMS-163.