Fig. A13.

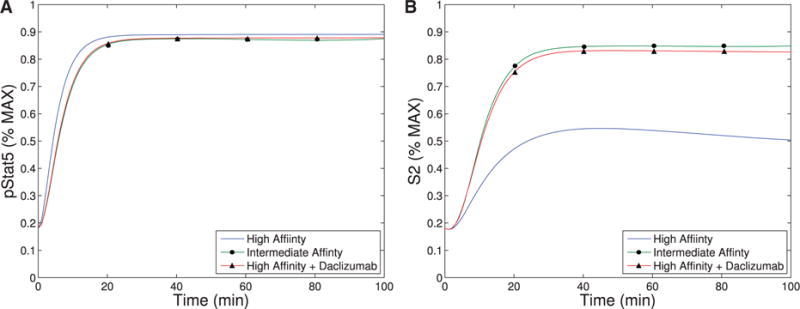
This figure plots the pSTAT5 signal (A) and S2 signal (B) for IL-2 concentration of 5 nM for cells with CD25 (without circle or triangle), cells without CD25 (circle) and cells with CD25 treated with Daclizumab (triangle).

This figure plots the pSTAT5 signal (A) and S2 signal (B) for IL-2 concentration of 5 nM for cells with CD25 (without circle or triangle), cells without CD25 (circle) and cells with CD25 treated with Daclizumab (triangle).