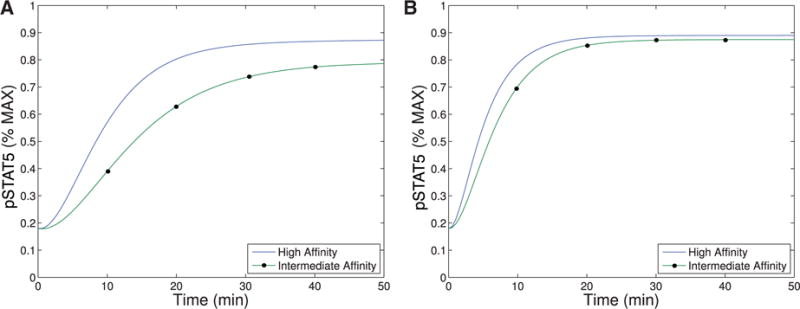
Fig. 2.

This figure shows qualitative matches to data presented in Fig. A1.C. In particular, Figure (A)plots the production of pSTAT5 for high and intermediate affinity IL-2 receptors for cells treated with 1 nM IL-2. Notice that there is delayed production of pSTAT5 associated with the intermediate affinity receptor with the equilibrium concentration being only slightly lower (< 10%). Figure (B) shows the prediction of the model if we instead treat with a moderate levels of IL-2 (5 nM). In this case, the differences in equilibrium concentration decrease significantly (< 2%) and the kinetic differences become very small as well.
