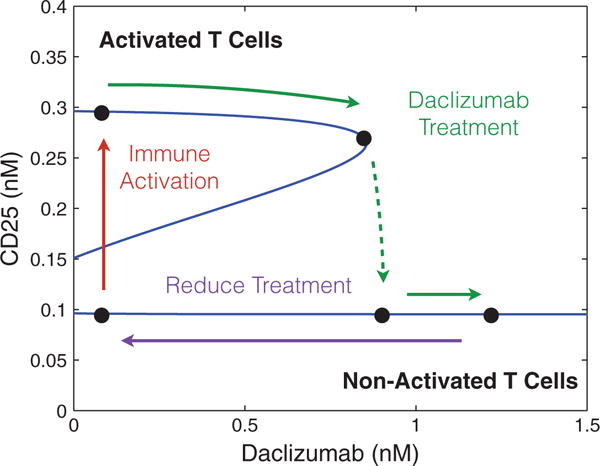
Fig. 4.

The figure demonstrates a saddle node bifurcation caused by adjusting the concentration of Daclizumab in the system for specific values of IL-2 and CD122 (0.1 nM of each). Values for V0, C0, K0 and n were determined by fitting data produced by Model I. Additionally, and were chosen to ensure the model demonstrated bistability when the concentration of Daclizumab was zero.
