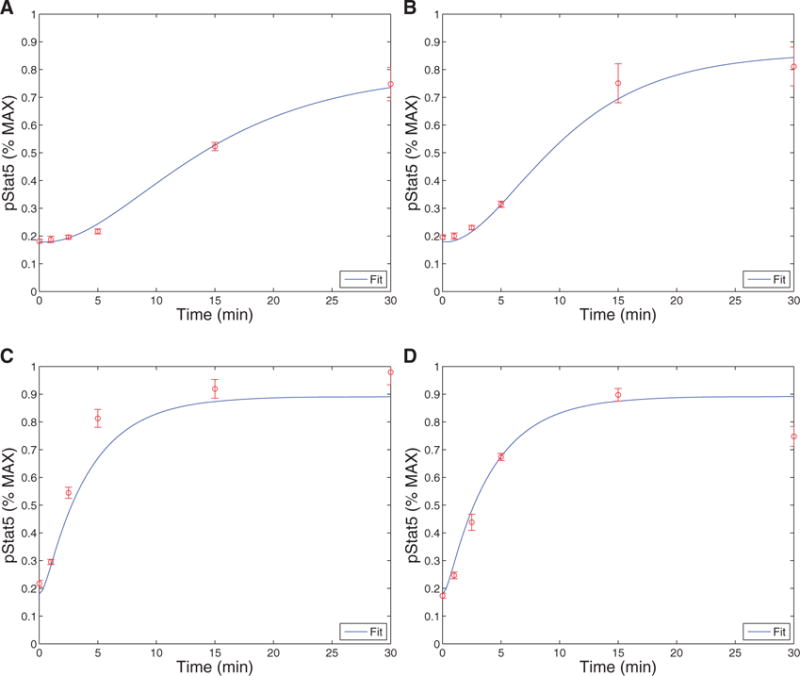
Fig. A2.

Model fits to the data from Ring et al. (2012). The experiments were run in triplicate. The plots show the model curve (curve) plotted with the experimental data. Figures (A) and (B) show the production of pSTAT5 over time for cells with no CD25 in the case of low (1 nM) and high (500 nM) IL-2, respectively. Figures C and D also shows the production of pSTAT5 over time except for cells with CD25, again in the case of low (1 nM) and high (500 nM) IL-2. Note that 5 parameters and two initial conditions were estimated by fitting this data (R2 = 0.9588).
