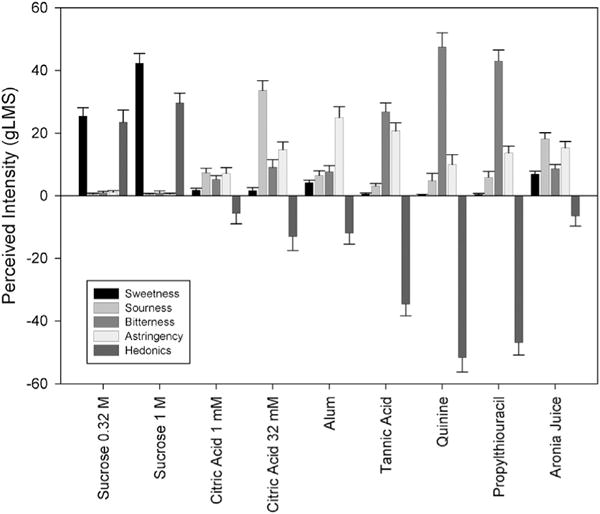
Fig. 3.

Perceived intensity (±S.E.M.) of sensation or degree of liking/disliking of aqueous sweet (0.32, 1 M sucrose), sour (1, 32 mM citric acid), astringent (1 g/L alum, 1 g/L tannic acid) and bitter (0.32 mM quinine hydrochloride, 3.2 mM propylthiouracil), and aronia juice averaged across the 7 harvest weeks on the general Labeled Magnitude Scale (gLMS) (Bartoshuk et al., 2004), where 0 = neutral, ±1.4 barely detectable, ±6 weak, ±17 moderate, ±35 strong, ±53 very strong.
