Fig. 2.
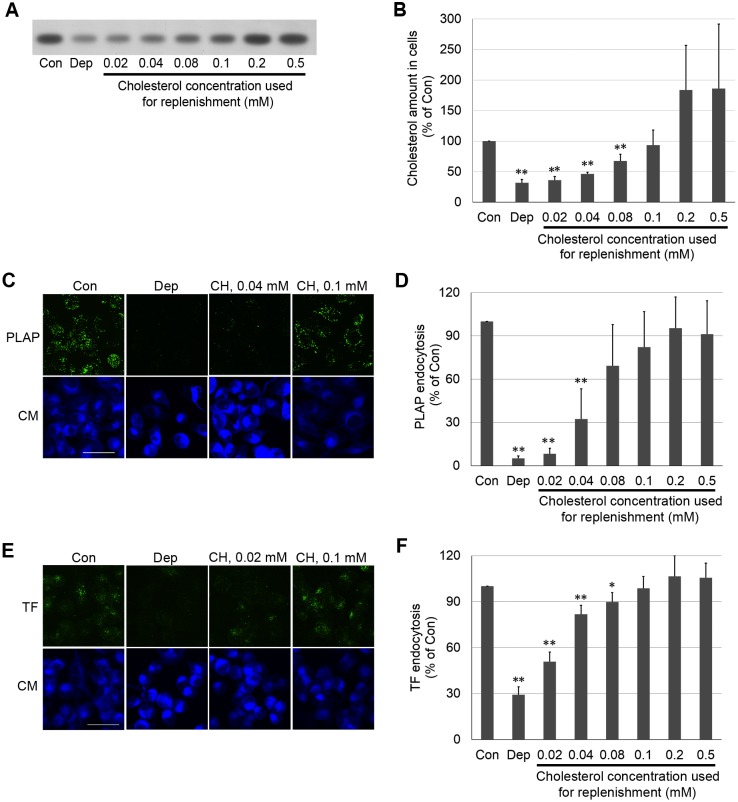
Both PLAP- and TF-endocytosis are regulated by cholesterol amount in cells. (A) HP-TLC plate showing cholesterol amount in cells after cholesterol depletion (Dep) or replenishment. (B) Quantified cholesterol amounts determined from HP-TLC band intensity. (C) z-stack micrographs of PLAP endocytosis after cholesterol depletion or replenishment. After cholesterol depletion or replenishment, PLAP was clustered with antibody (green fluorescence), and clustered PLAP was internalized in a 20 min incubation at 37°C. Cell surface antibodies were removed by acid washing, and cell membranes were counter-stained with CellMask (CM, blue fluorescence). (D) Internalized PLAP puncta per cell. In each experiment 3–7 images (total cell number ≥50) were used for puncta quantitation. (E) z-stack micrographs of TF endocytosis after cholesterol depletion or replenishment. After cholesterol depletion or replenishment, TFRs on cell surface were bound with AF488–TF (green fluorescence) and allowed to endocytose in a 7 min incubation at 37°C. AF488–TF remaining on cell surface was removed by acid washing. Cell membranes were counter-stained with CellMask. (F) TF endocytosis in cells quantifed from integrated fluorescence intensity. Endocytosis in 50 cells (2–3 images) was analyzed in each experiment. In B, D and F, the mean±s.d. from three independent experiments are shown. Values normalized to untreated control cells. Con, untreated control cells; Dep, cholesterol-depleted cells; CH, cholesterol. Scale bars: 50 µm. *P<0.05; **P<0.01 compared to ‘Con’ (unpaired, two-tailed Student's t-test).

