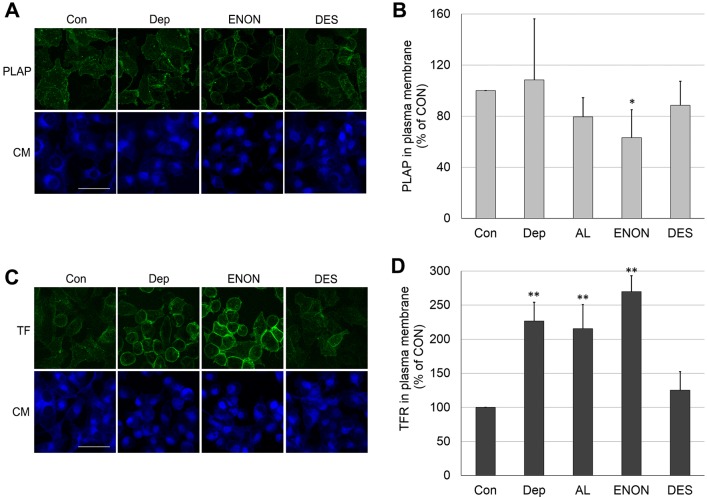
Fig. 4.
PLAP and TFR protein levels in plasma membrane after cholesterol depletion or its replacement with another sterol. (A) Images of PLAP staining (green) on the cell plasma membrane, counter-stained with CellMask (CM, blue fluorescence). (B) Quantification of PLAP fluorescence intensity. (C) Images of TFR staining (green) on the cell plasma membrane. (D) Quantification of TFR fluorescence intensity. PLAP and TFR on the cell surface were detected by analyzing the immunofluorescence of antibody binding to cells that had been fixed after sterol manipulation. The fluorescence intensity/cell of 50 cells/experiment was then measured. Con, untreated control cells; Dep, cholesterol-depleted cells; AL, allocholesterol; ENON, 4-cholesten-3-one; DES, desmosterol. In B and D, the mean±s.d. are shown from three independent experiments. Scale bars: 50 µm. *P<0.05; **P<0.01 compared to ‘Con’ (unpaired, two-tailed Student's t-test).

