Fig. 4.
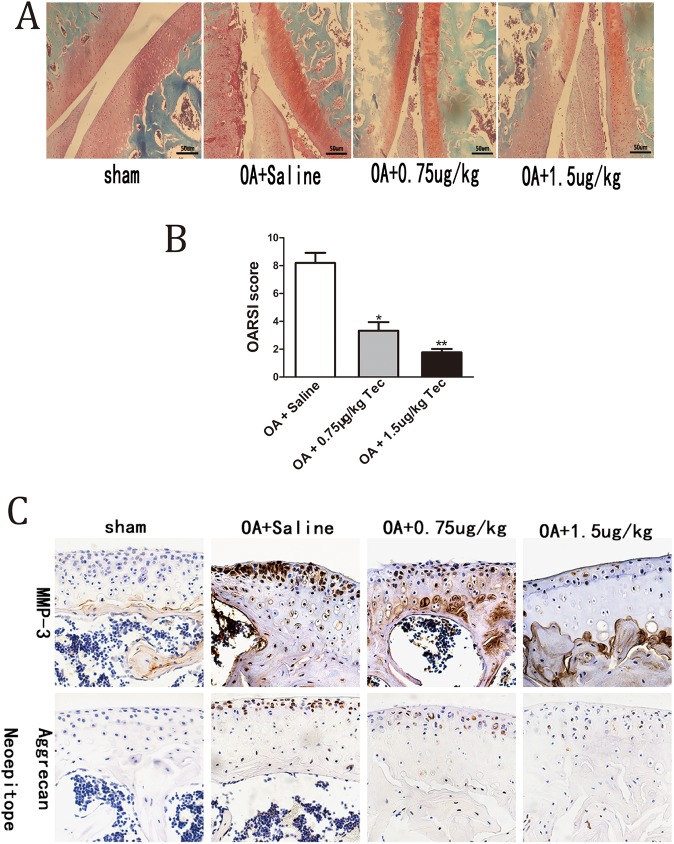
Effects of Tec treatment on surgically induced OA. (A) Knee joints were harvested at 6 weeks postsurgery and analyzed histologically via Safranin O−fast green staining. Representative images are shown. (B) OA of the femoral and tibial cartilage was scored histologically using the OARSI scoring system at 8 weeks postsurgery. (C) Immunohistochemical staining of Aggrecan Neoepitope and MMP-3. Data are expressed as mean±s.e.m. (n=10). *P<0.05, **P<0.01, compared to treatment with saline. Scale bars: 50 μm.

