Fig. 3.
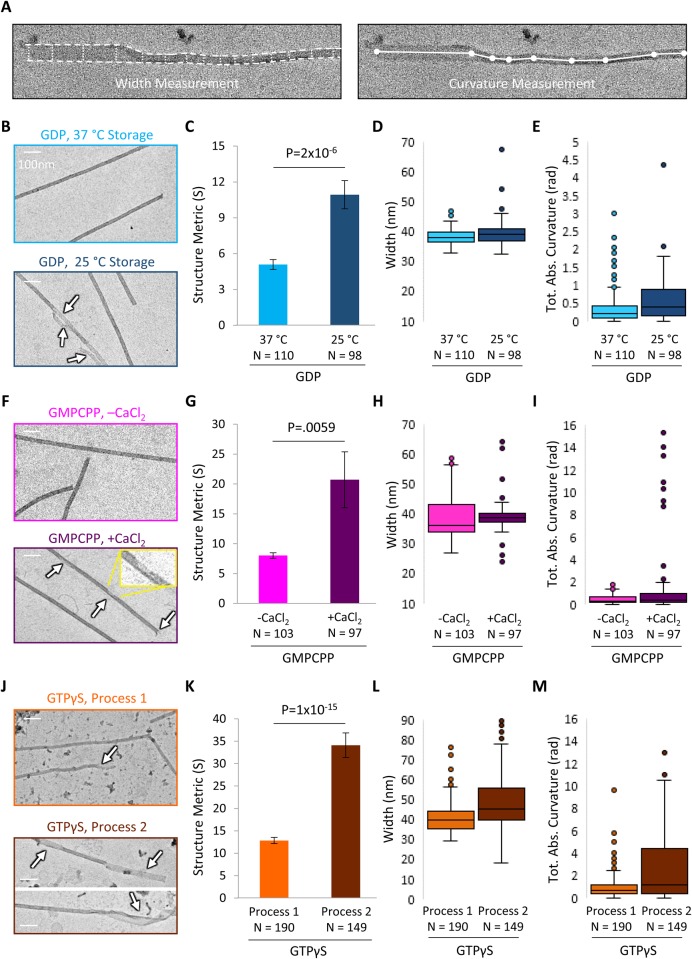
Large-scale lattice integrity is shifted within microtubule pools. (A) Visualization of EM quantification method. Left: width measurement in the Structure Metric. Right: curvature measurement in the Structure Metric. (B) Sample EM images of 37°C storage GDP microtubules (top) and 25°C storage GDP microtubules (bottom; arrows indicate structural disruptions). (C) Structure Metric is increased at 25°C storage, suggesting that large-scale microtubule structure is disrupted. (D,E) Width measurements and curvature measurements contribute to the Structure Metric. (F) Sample EM images of untreated GMPCPP microtubules (top) and CaCl2 treated microtubules (bottom; arrows indicate structural disruptions, inset is enlargement). Scale bars: 100 nm. Structure Metric is increased with CaCl2 treatment (bottom), suggesting that large-scale microtubule structure is disrupted. (H,I) Width and curvature measurements contribute to structure metric. (J) Sample EM images of GTPγS microtubules prepared and stored using Process #1 (top) and Process #2 (bottom; arrows indicate disrupted structure). Scale bars: 100 nm. Structure Metric is increased with Process #2, suggesting that large-scale microtubule structure is further disrupted with Process #2 as compared to Process #1. (L,M) Width and curvature measurements contribute to the overall Structure Metric. The bar graphs in C, G and K show mean±s.e.m.; P-values were calculated from t-test of independent means.

