Fig. 6.
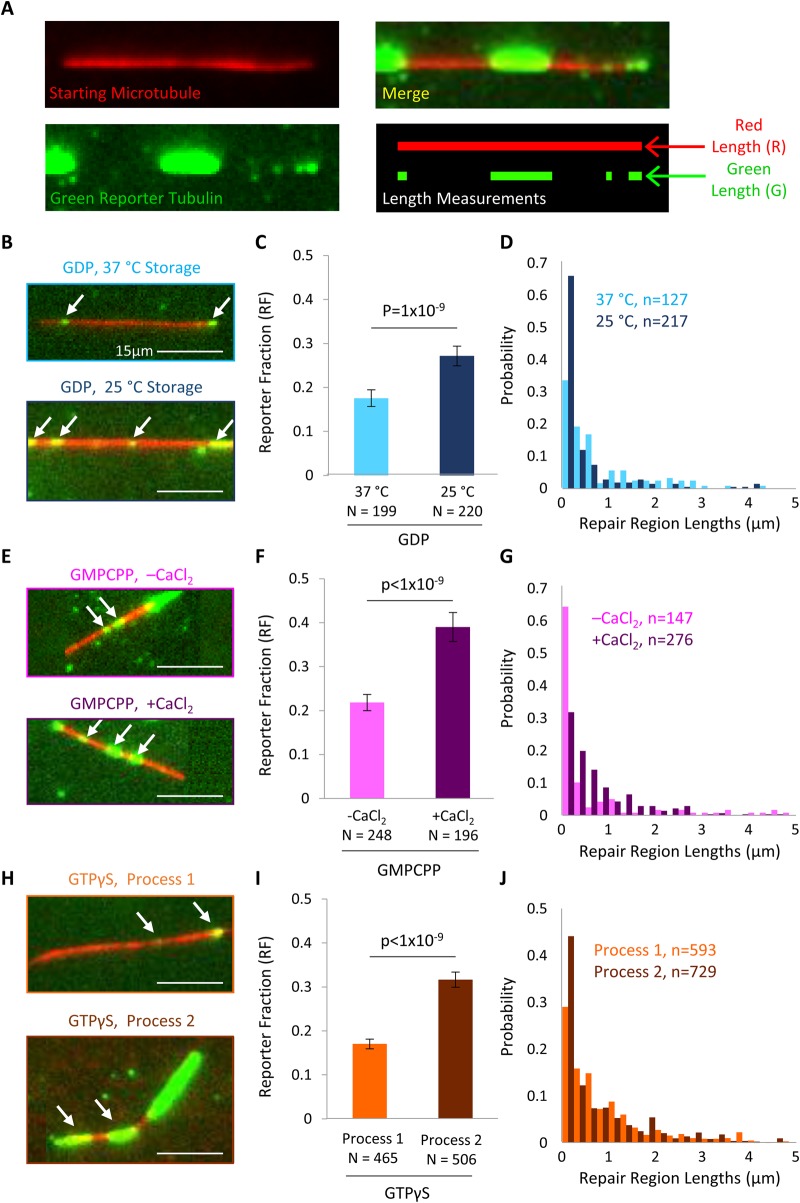
Microtubule lattice integrity is shifted within microtubule pools. (A) Top: example microtubule (red) after repair by reporter tubulin (green). Bottom: depiction of quantification technique for Reporter Fraction (RF) using Red Length (R) and Green Length (G). (B) Representative images of microtubules after gap filling assay repair for 37°C storage GDP microtubules (top) and 25°C storage GDP microtubules (bottom). The white arrows indicate sites of reporter tubulin incorporation. (C) The Reporter Fraction is increased for 25°C storage GDP microtubules (right) relative to 37°C storage GDP microtubules, suggesting that storage at 25°C does not promote repair of gaps and defects in the microtubule lattice. (D) Distribution of repair lengths. (E) Representative images of microtubules after gap filling assay repair for untreated GMPCPP microtubules (top) and for GMPCPP microtubules treated with CaCl2 (bottom). (F) The Reporter Fraction is increased for CaCl2-treated microtubules (right) relative to untreated microtubules, suggesting that CaCl2 treatment may lead to gaps and defects in the microtubule lattice. (G) Distribution of repair lengths. (H) Representative images of microtubules after gap filling assay repair for Process #1 GTPγS microtubules (top) and Process #2 GTPγS microtubules (bottom). (I) The Reporter Fraction is increased for Process #2 GTPγS microtubules (right) relative to Process #1 GTPγS microtubules, suggesting that Process #2 does not promote repair of gaps and defects in the microtubule lattice. (J) Distribution of repair lengths. The bar graphs in C, F and I show the mean±s.e.m. repair fraction, weighted by microtubule length (Fig. S3), and corrected for nonspecific background contribution; P-values were calculated from Student's t-test.

