Fig. 1.
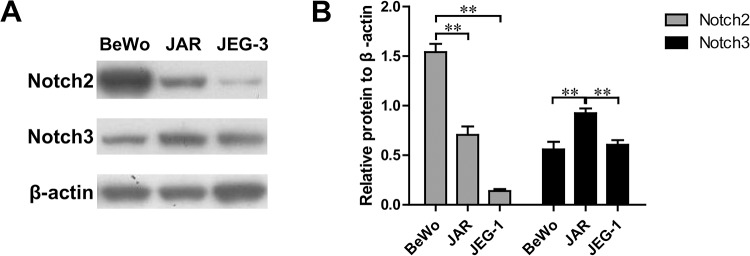
Notch2 and Notch3 expression in trophoblast cell lines. (A) Western blotting revealed differences in endogenous Notch2 and Notch3 expression in three human trophoblast cell lines: BeWo, JAR, and JEG-3. β-actin was used as a loading control. (B) Protein levels of Notch2 and Notch3 were quantified by normalizing the intensity for each band with that of β-actin. Data are mean±s.d. **P<0.01.

