Fig. 2.

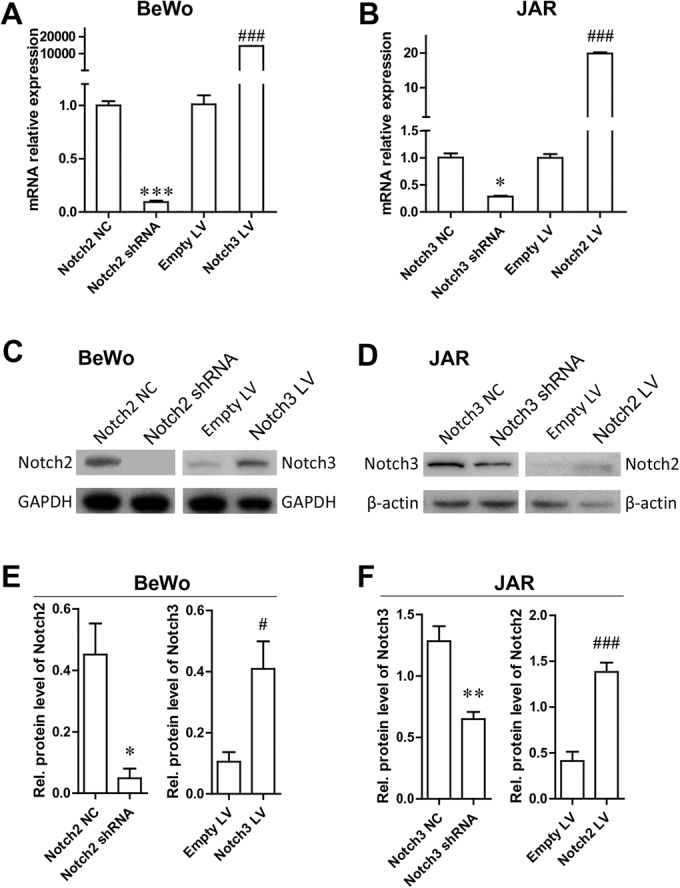
Notch2 and Notch3 shRNA silencing and expression efficiencies. (A) qRT-PCR analysis of Notch2 and Notch3 mRNA in BeWo cells with Notch2 knockdown or Notch3 overexpression. (B) qRT-PCR analysis of Notch2 and Notch 3 mRNA in JAR cells with Notch3 knockdown or Notch2 overexpression. (C) Western blot analysis of Notch2 and Notch3 protein in BeWo cells with Notch2 knockdown or Notch3 overexpression. (D) Western blot analysis of Notch2 and Notch3 protein in JAR cells with Notch3 knockdown or Notch2 overexpression. (E,F) Densitometric analysis of Notch2 and Notch3 protein levels in C and D. *P<0.05, **P<0.01, ***P<0.001, compared with the negative control (NC); #P<0.05, ###P<0.001, compared with Empty LV.
