Fig. 4.
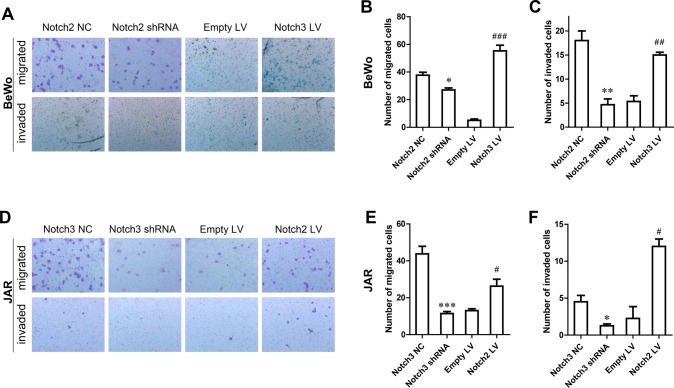
Effects of Notch2 and Notch3 on trophoblast cell migration and invasion. (A) Migration and invasion assay of BeWo cells transfected with Notch2 shRNA (magnification 100×). (B) The number of migrated BeWo cells in the migration and invasion assay. (C) The number of invaded BeWo cells in the migration and invasion assay. (D) Migration and invasion assay of JAR cells transfected with Notch3 shRNA (magnification 100×). (E) The number of migrated JAR cells in the migration and invasion assay. (F) The number of invaded JAR cells in the migration and invasion assay. Cell numbers represent mean±s.d. values per field (from at least five fields) from independent experiments. *P<0.05, **P<0.01, ***P<0.001, compared with NC; #P<0.05, ##P<0.01, ###P<0.001, compared with Empty LV.

