Fig. 2.
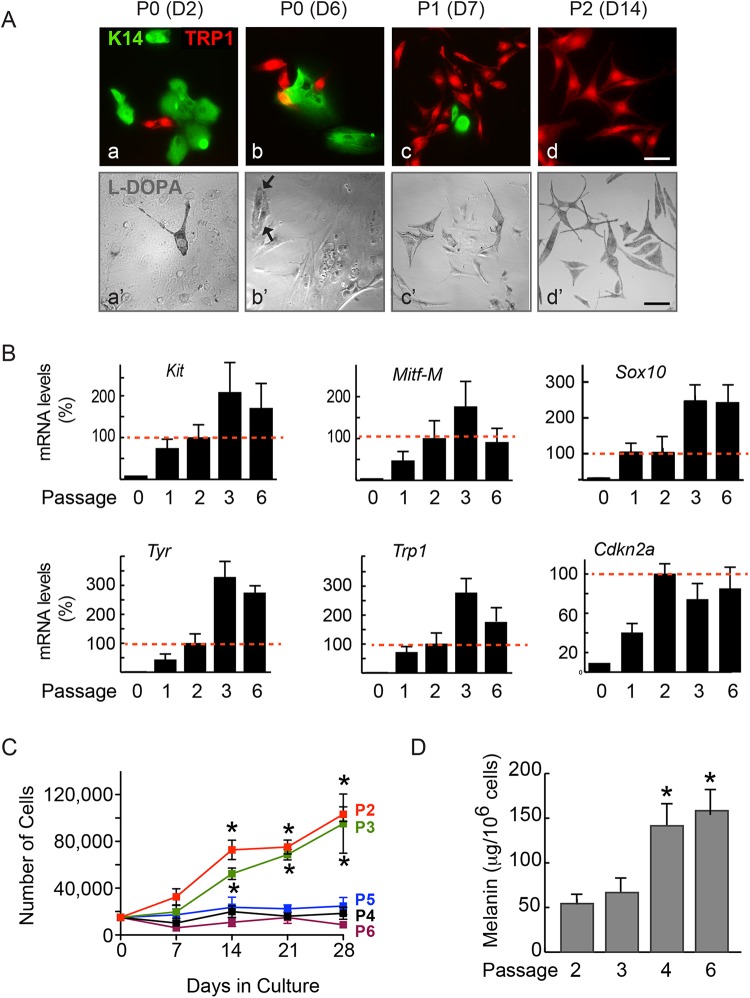
Characteristics of primary mouse melanocyte cultures. (A) Epidermal cell suspensions were cultured for the indicated number of days (D) and passages (P). The cells were processed for immunofluorescence microscopy to detect keratin 14 (K14) in keratinocytes and TRP1 in melanocytes (a,b,c,d), or stained with L-DOPA, which is converted to a brown pigment only in melanocytes (a′,b′,c′,d′). Arrows indicate the melanocytes in P0 cultures. Scale bars: 50 µm. (B) mRNA was isolated from melanocyte cultures at the indicated passage numbers, reverse transcribed and analyzed by qPCR to determine the relative abundance of the indicated transcripts. The results were obtained from three technical replicates per cDNA tested, and are expressed as the mean+s.d. from three independent cell isolates, relative to mRNA levels in P2 cells, which are set to 100% (red dotted line), because P2 cells are the earliest passage composed of ≥95% melanocytes. (C) Melanocytes at the indicated passages were cultured, trypsinized and the number of trypan blue-excluding cells was determined at the indicated intervals following seeding. The data were obtained from duplicate samples for each of three independent cell isolates, and are expressed as mean±s.d., and *P<0.05 relative to the number of cells seeded at D0 (n=3, two-way ANOVA). (D) Melanin was extracted and quantified in cultures at the indicated passages. The data are expressed as mean melanin content+ s.d., and *P<0.5 relative to melanin in P2 cells (n=3, one-way ANOVA).

