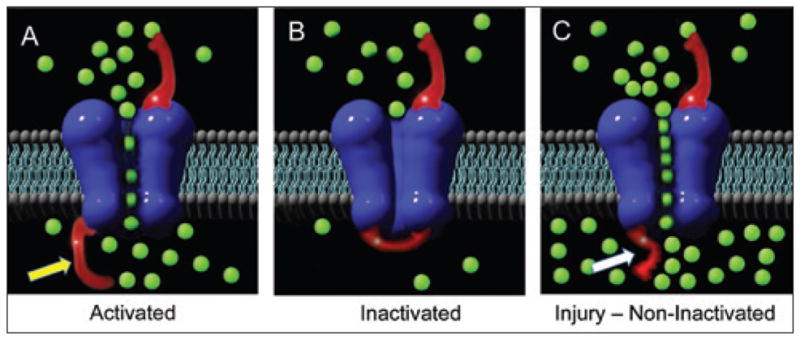
FIGURE 2.

Diagram of the axonal membrane showing (A) sodium channel (blue) assemblage with the inactivation gate or “flapper valve” (shown with yellow arrow) with normal sodium influx (green balls) that create an action potential; (B) normal inactivation closes the gate to allow efflux of sodium; (C) upon injury, the inactivation gate is rendered dysfunctional (white arrow), allowing unmitigated influx of sodium ions.
