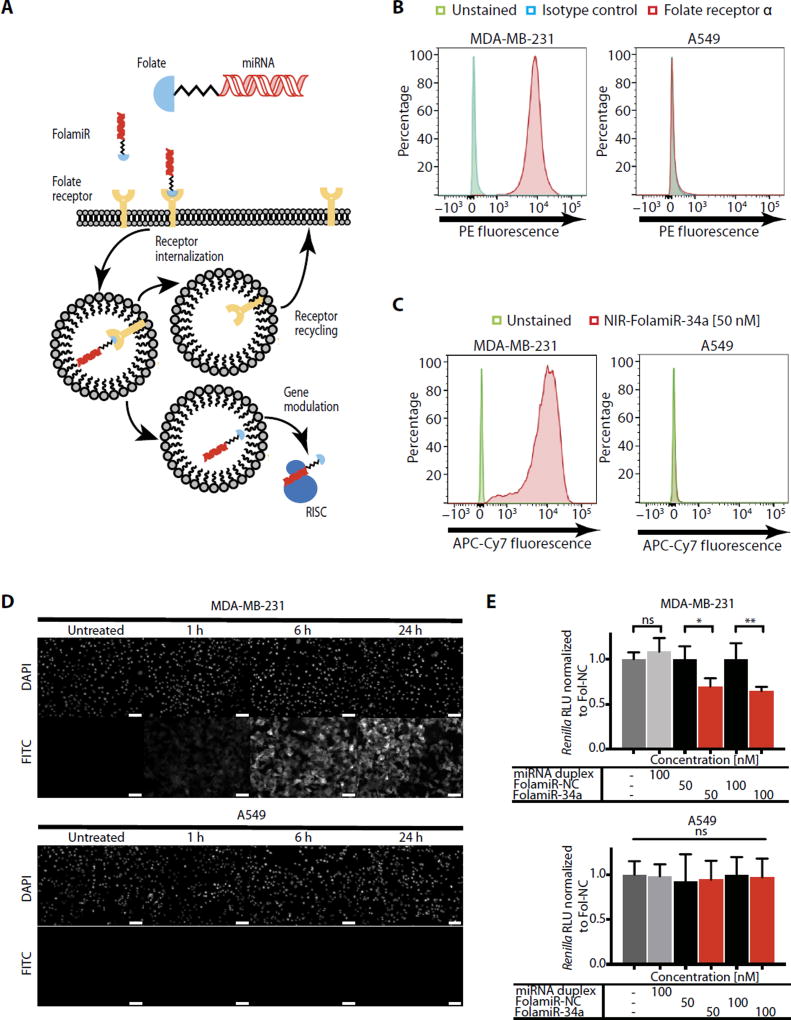
Fig. 1. Specificity of FolamiR uptake in cancer cells in culture.
(A) Proposed mechanism of action of FolamiRs. (B) Identification of FRα in FR+ MB-231 breast cancer cells and in FR− A549 lung cancer cells. Histograms represent overlaid flow cytometry data as a percentage of unstained, FRα+, and isotype control–stained cells. (C) NIR-FolamiR-34a uptake in FR+ MB-231 cells compared to FR− A549 cells. Histograms represent overlaid flow cytometry data as a percentage of unstained and NIR-FolamiR-34a (50 nM)–stained cells. (D) Fol-FITC uptake in FR+ MB-231 cells compared to FR− A549 cells. Scale bars, 50 µm. (E) Targeted silencing of miR-34a Renilla sensor using FolamiR in MB-231 and A549 cells in vitro. Data points were normalized to FolamiR-NC (negative control: scrambled miRNA) for each time point. Error bars: means ± SD. Each experiment corresponds to n = 3 with at least four technical replicates per treatment. **P < 0.01, *P < 0.05, one-way analysis of variance (ANOVA) and Bonferroni correction. ns, not significant.

