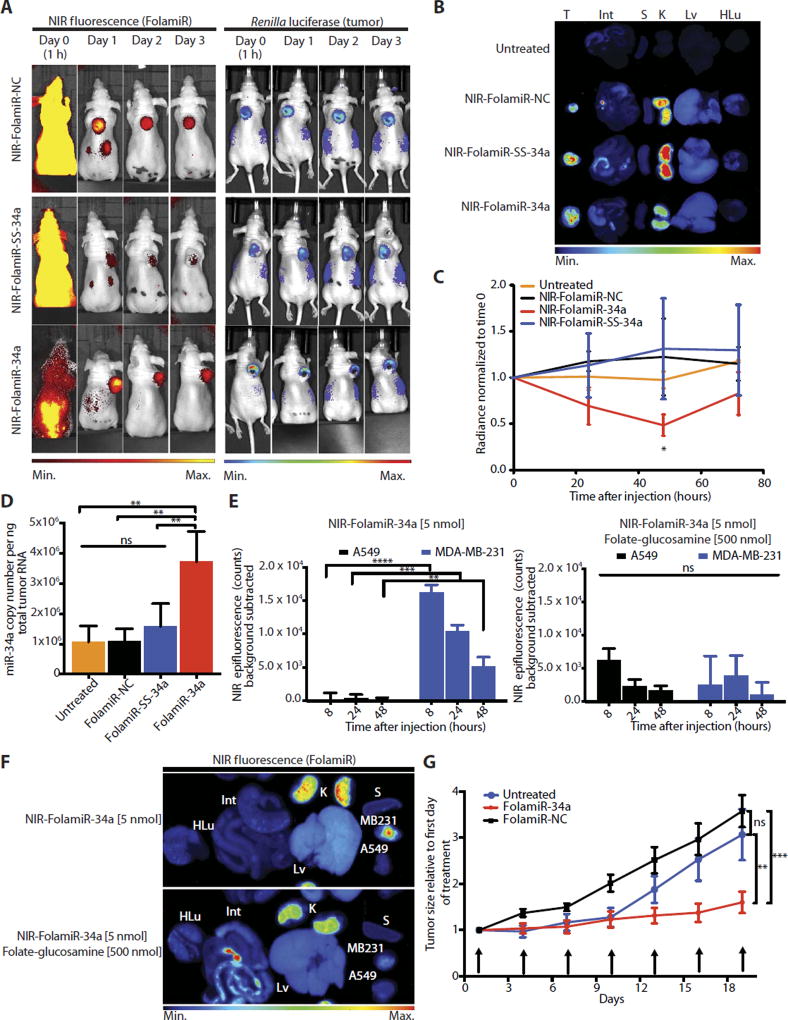
Fig. 3. FolamiR-34a inhibits the growth of MB-231 tumors in mice.
(A) Representative live imaging of female Nu/Nu congenic mice implanted with MB-231 sensor xenografts after intravenous injection of NIR-FolamiR-NC, NIR-FolamiR-SS-34a, or NIR-FolamiR-34a (4 mg/kg, 5 nmol). Left: NIR fluorescence distribution. Right: MiR-34a Renilla luciferase sensor signal. (B) Gross images of excised MB-231 tumors (T) and whole organs (Int, intestines; S, spleen; K, kidneys; Lv, liver; HLu, heart and lungs) visualized for fluorescence. (C) Effects of NIR-FolamiR-34a delivery on miR-34a Renilla sensor activity over time; data normalized to Renilla signal at day 0 (error bars: means ± SEM, n = 3). (D) miR-34a expression from excised MB-231 tumors measured by quantitative reverse transcription polymerase chain reaction (qRT-PCR) 72 hours after injection with NIR-FolamiR conjugates (n = 3; error bars: means ± SD). (E) NIR epifluorescence quantification from live animals. Nude mice were implanted with A549 cells on the left shoulder and MB-231 cells on the right shoulder, and live imaging was conducted after intravenous injection of NIR-FolamiR-34a (4 mg/kg, 5 nmol) in the presence (right graph) or absence (left graph) of ≥100-fold molar excess of folate-glucosamine (n = 3, error bars: means ± SD). (F) Fluorescence distribution of excised organs and tumors from (E). A549: FR− tumor; MB-231: FR+ tumor. (G) Tumor size after FolamiR-34a treatment (n = 5; error bars: means ± SEM). Arrows represent treatment times (0.8 mg/kg, 1 nmol intravenous injection). *P < 0.05, **P < 0.01, ***P < 0.001, ****P < 0.0001, one-way (D and E) or two-way (B and G) ANOVA with Bonferroni correction.

