
Fig. 2.
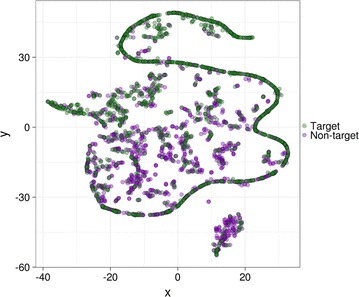
Exploratory data analysis of the working dataset using dimensionality reduction. The t-SNE algorithm for non-linear dimensionality reduction was run a perplexity value of 30 and other default parameters. Each dot in the two-dimensional space represents a gene and is coloured according to its label (green target, purple non-target)